Skype for Business 2015 (premise) Addendum MP

Ever try to figure out a Skype alert, for which server in the pool(s) is failing?


While maybe not the clearest to find root cause, the Skype pack brings a bunch of functionality, including synthetic transactions.


I was lucky enough to collaborate with Nick Wood, Skype PFE, to help provide more detail, troubleshooting, impact on what is critical versus warning.


What the addendum pack brings

Do you think 656 monitors can all be critical?

  • Sets up service restart recovery tasks for all Skype services
  • Company Knowledge tab for troubleshooting/user impact


Gallery Download


Here is a visual of our Skype efforts for integrating troubleshooting details into SCOM console.

NOTE:  Company Knowledge tab would be accessible from the alert as well


Company Knowledge

SCOM Console, Authoring tab, Dispatcher Queue monitor

Highlight monitor, right click, choose properties

Click on ‘Company Knowledge’ tab

Incorporated the XLS into SCOM under Company Knowledge for additional information on user impact, causes, and troubleshooting (under resolutions)


Active Directory 2012-2016 Addendum packs updated

Man time flies!


Thought I’d share some new functionality for AD DS (Active Directory Domain Services)


Ran across some customer errors with AD Event ID 1084, which exists in the old 8321 pack, but not in the v10.x pack.

Well, if you get these errors, your DC isn’t replicating, and most likely will need to be rebuilt.


Gallery download


Broke out the packs to separate the Recovery Tasks in their own pack, versus added functionality in the addendum.

Figured better to send packs NOT sealed, so that meant 2 packs,

WYSIWYG (wizzy-wig acronym)


What this means

v1.0.0.1 pack had just the AD DS Service Recovery Tasks

v1.0.0.2 pack has a Service Recovery Tasks pack, and the Addendum pack

What I think is cool is that the Addendum pack contains 2 rules, simple rule event (enabled by default), and also a PowerShell rule.


Rule Figured out how to simply look for criteria, count it, and alert on it.

We always look for alert suppression, some of the sliding/counting monitors are too much.


Starting with Holman’s alerting rule fragment, we can create more powerful combinations than just a single symptom.

Using Variations of the get-date command, we can actually specify how far back to look, to count for alerts.

Easier method to count events, to figure out an alert threshold.


From the rule in the Addendum pack

# Check blog for more detail https://blogs.technet.microsoft.com/heyscriptingguy/2015/01/21/adding-and-subtracting-dates-with-powershell/
# If you want this in other time increments – AddHours, AddSeconds, AddMilliseconds
#
$LastCheck = (Get-Date).AddMinutes(-65)

[int]$TempCount = (get-eventlog -logName “Directory Service” -Source “NTDS Replication” -InstanceID 1084 -Message “*8451 The replication operation encountered a database error*” -After $LastCheck).Count

IF ($TempCount -ge 1)
{
$Result = “BAD”
$Message = “The number of 1084 Replication Database error events was greater than 1”
}
ELSE
{
$Result = “GOOD”
}


Maybe we need multiple event ID’s, or search multiple event logs… you decide, and let me know.


System Center Orchestrator 1801 Integration Packs


Orchestra…?


FYI – Additional IP’s released this month for Orchestrator, SMA, and SPF

Orchestrator https://www.microsoft.com/en-us/download/details.aspx?id=56558

Service Management Automation https://www.microsoft.com/en-us/download/details.aspx?id=56559

Service Provider Foundation https://www.microsoft.com/en-us/download/details.aspx?id=56557


In case you didn’t know, from Lynne Taggart’s blog , these integration packs (IP) were released in February:

System Center 1801+ Integration Pack for HP iLO and OA
System Center 1801+ – Orchestrator Integration Packs
System Center 1801+ Integration Pack for HP Service Manager
System Center 1801+ Integration Pack for IBM Tivoli Netcool/OMNIbus
System Center 1801+ Integration Pack for VMware vSphere
System Center 1801+ Integration Pack for HP Operations Manager


Have fun automating!

Dock the Outlook calendar

Tired of clicking to see your Outlook calendar?


I recently lost the ‘Outlook peek’ off my Outlook client, and panicked!

Here’s the Office Support link https://support.office.com/en-us/article/Change-how-you-view-your-Outlook-calendar-A4E0DFD2-89A1-4770-9197-A3E786F4CD8F


It’s real easy to fix, but man it eluded me there [ as I over think it 🙂 ]


Right click on the calendar icon (lower left hand corner)

Choose Dock the peek


Voila!  calendar shows on your email tab


Office support article

OMS Heartbeat failures and creating alerts


Feel like you have a ton of data, but lack insights?


Would like to thank the Product team to clarify how to do this with Kusto (new OMS Query language)


If you use OMS and need to verify the most recent data collection

Heartbeat | summarize max(TimeGenerated)

If you want to check a specific machine you can run this one:  

Heartbeat | where Computer==”contosovm” | summarize max(TimeGenerated)

If you want to build an alert based on it you can write something like:

Heartbeat | where Computer==”contosovm” | summarize m=max(TimeGenerated) | where m < ago(15m)

The last query will return result only if you have heartbeat missing for more than 15 minutes.


If you need additional information on OMS query syntax, check out Antoni’s blog

https://blogs.technet.microsoft.com/antoni/2018/02/03/operations-management-suite-101-log-analytics-queries-101/


Kusto site http://kusto/

SQL MP bloat

Updated 25 Feb 2023


Ever wish alerts were like a wad of cash?

The more you solve, the more you make!


How about performance counter data?


The SQL management packs are awesome for visualizations, and provide a bunch of data.


Tim McFadden pointed out SQL Performance counters https://www.scom2k7.com/crazy-db-performance-collection-rules-in-the-sql-mps/

His blog brings up SQL MP Disk Latency performance counters.


His blog got me thinking about SQL DB and DB file design, where multiple DB files are on the same Drive, causes duplicate performance counters (SCOM workflows) on the agent, and will typically be one of the culprits for HealthService restarts.


SQL MP creates performance counters (per DB file, group, instance, engine)


Let’s start with how I figured out why all my money goes into storage.


Start in the SCOM console

Click on the Reporting Tab

Click on the ‘System Center Core Monitoring Reports’ folder

Double click on the Data Volume by Management Pack

View of SCOM report from console reporting tab

Select the timeframe (from, to)

Click Run

Data Volume MP selected


Reporting Data

I have 2 2016 DB’s and 1 2014 (SCVMM) database server monitored, and it’s 50% of my data volume!


Another example – had the DW shutdown for days

Data volume of SQL after


Did you know there are 60+ perf counter rules in 2012 alone, and nearly 200 in 2016?


How about an OFF pack, a management pack that turns off all the performance counter rules?

The monitors still exist for health, just no pretty performance graph, should you look.


Github repo link

Check out the Gallery post for download

TechNet gallery download


Zip file contains

  1.  OFF MP’s for 2008,2012,2014,2016
  2. XLS sheets to allow you to go to the SQL team and ask them what performance counters they use


2016 SQL SP1 patch issue

False alert?


If you have SQL2016 SP1 monitored in SCOM, you most likely have Compliance monitor warnings


This is actually a problem with SP1 where SQL did not update the registry key.


Two options to remedy:

  1. Disable SCOM monitor per instance (or class if SP1 is NOT in your environment)
  2. Fix the offending SQL Servers that are patched to SP1


Steps to fix the offending SQL Servers patched to SP1

Update Registry Key


Via PowerShell


TechNet forum is nice as well, but had to tweak it (blog listed here )


# Get Instance

$Instance = (Get-ItemProperty “HKLM:\SOFTWARE\Microsoft\Microsoft SQL Server”).InstalledInstance )

NOTE: If you have multiple instances, you will need a foreach loop

# Get Version

$Version = (Get-ItemProperty “HKLM:\SOFTWARE\Microsoft\Microsoft SQL Server\$((Get-ItemProperty ‘HKLM:\SOFTWARE\Microsoft\Microsoft SQL Server\Instance Names\SQL’).$Instance)\Setup”).Version

# Match Version and set Registry Key
if ($Version -match ‘13.1.4’)

{

Set-ItemProperty -Path “HKLM:\SOFTWARE\Microsoft\Microsoft SQL Server\$((Get-ItemProperty ‘HKLM:\SOFTWARE\Microsoft\Microsoft SQL Server\Instance Names\SQL’).$Instance)\Setup” -Name ‘SP’ -Value 1

}

# Verify

Get-ItemProperty -path “HKLM:\Software\Microsoft\Microsoft SQL Server\MSSQL13.MSSQLSERVER\Setup” | ft SP


Steps broken out


Get Registry Key value via PowerShell


Get-ItemProperty -path “HKLM:\Software\Microsoft\Microsoft SQL Server\MSSQL13.MSSQLSERVER\Setup” | ft SP


Set Registry Key


Set-ItemProperty -path “HKLM:\Software\Microsoft\Microsoft SQL Server\MSSQL13.MSSQLSERVER\Setup” -name “SP” -value 1


Verification

Verify via PowerShell


Verify via RegEdit


Reset SCOM Monitor


And the false alert is gone!

Importing OMS views

Perusing the TechNet Gallery looking at other’s contributions, I came across some cool new OMS views by Cameron Fuller and Marin Frankovic 


What came next kept me puzzled for a few minutes… Where do I go to export/import views in OMS?


How to add views to OMS

From OMS,

Click the + sign for View Designer


Click Import (can only select one view at a time)

Click Browse at bottom


Select OMSview file to import

Click Open


Verify Overview Tile

Click Save


Click Home icon to return


Monitor Sensitive User

Custom Views https://docs.microsoft.com/en-us/azure/log-analytics/log-analytics-view-designer

Download https://gallery.technet.microsoft.com/Monitor-sensitive-user-and-5a721d64

Server Performance

                Blog http://blogs.catapultsystems.com/cfuller/archive/2017/11/28/updating-the-server-and-client-performance-solution-to-the-new-query-language/

                Download https://gallery.technet.microsoft.com/scriptcenter/Server-Performance-3d767ab1


SCOM 1801 New Features (previously 1711 Technical Preview)


What does the new SCOM bring?!


HTML5 Web Dashboards! here

What’s New https://docs.microsoft.com/en-us/system-center/scom/what-is-new-1801?view=sc-om-1801

The SCOM Team published a 5 set blog post on Web Console https://blogs.technet.microsoft.com/momteam/2018/02/12/new-scom-web-console-blog-series-post1/


The new SCOM version also gives visibility into

Management Packs Updates and Recommendations

Operations Manager Products (view SCOM topology)

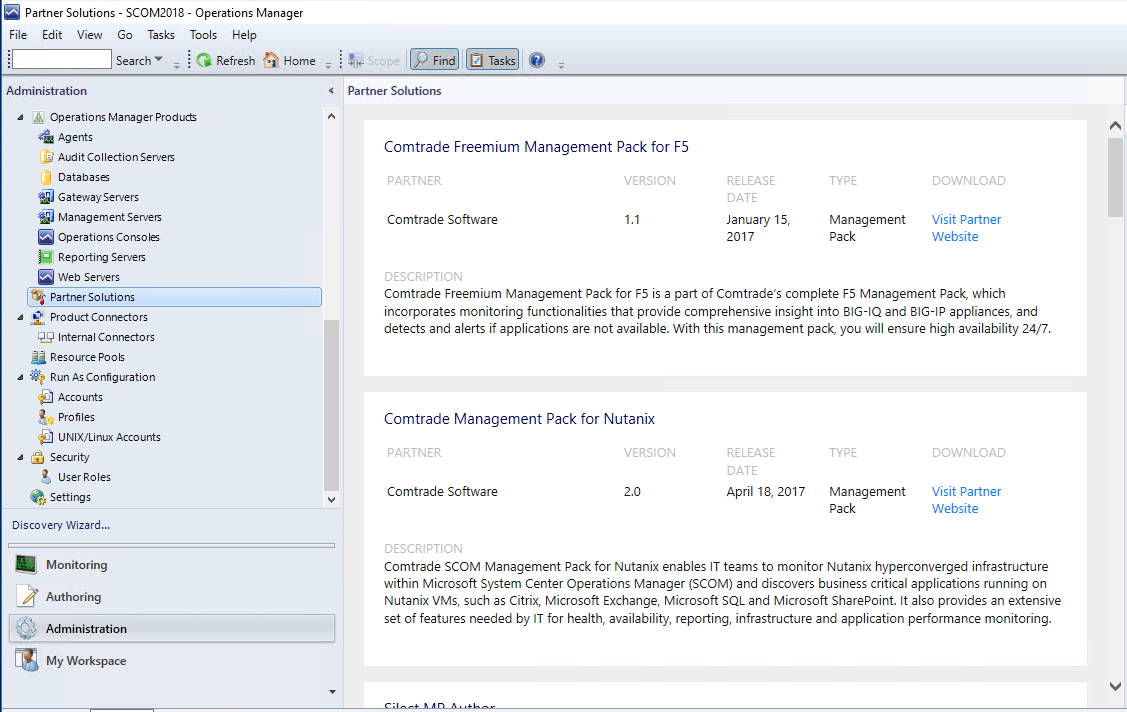
Partner Solutions


For now I’ll focus on the last two


Operations Manager Products

Click on Administration Tab

Expand Operations Manager Products

Topology features are pretty neat.

Whether you’re new to SCOM, or have interesting Server naming conventions, or someone built the environment and changed jobs or left the company…

At least you can easily find out how the SCOM environment is setup


Partner Solutions

Cool!

Silect MP Author, Comtrade, Nutanix, Veeam, Infront, ClearPointe, Backbone

Lync 2013 Addendum Management Pack

Continuing the Addendum tradition 🙂 Lync couldn’t be forgotten.


To understand options and methods available on the Server and SCOM, re-read the Active Directory Addendum blog


Lync 2013

Now that we understand the methods available, let’s get to the Addendum.


The Addendum pack has 32 Recovery Tasks for Lync Service Monitors.


The recoveries cover the following services:

Access Edge, CMS Master, File Transfer Agent, Lync Backup Service, Push Notification Service, Replica Replicator Agent, Online Telephony Conferencing, Audio Video Conferencing, BI Data Collector, Conferencing Attendant, Conferencing Announcement, Application Sharing, Persistent Chat, Persistenc Chat Compliance, Centralized Logging Service Agent, Call Park, Web Conferencing, Web Conferencing Edge, IM Conferencing, Legal Intercept Service, Log Retention Service, Audio Video Edge, Mediation, Audio Video Authentication, Bandwidth Policy Service Authentication, Bandwidth Policy Service Core, Server Response Group, Front End Service, World Wide Web Publishing, XMPP Translating Gateway, XMPP Translating Gateway Proxy.

The recovery tasks verify service state, start ‘not running’ services, and include the option to recalculate health.


My goal is automation that helps anyone work smarter versus harder, with the goal to avoid being woke up at 2am just to restart a service.


Gallery Download          https://gallery.technet.microsoft.com/Lync-2013-Addendum-2a92aa00