Now to begin – OMSAgent FluentD debunked
Configure Linux FluentD – part2 –> see part one (1) here)
First, my thanks to Mike Johnston@Microsoft (CSS SEE SME) to help validate my steps and testing, to configure Linux FluentD on an Ubuntu server! Are you ready to bust a myth – OMSAgent FluentD debunked
If you’re starting fresh, or just joining, start with Part 1. And Part 1 configures packs and assumes SCOM agent is installed and working. Because it’s time to use the feature, we need to get the agent configured and tested.
Part one (1) quick summary
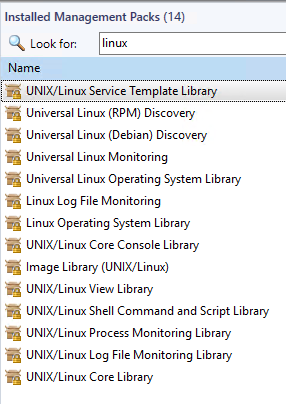
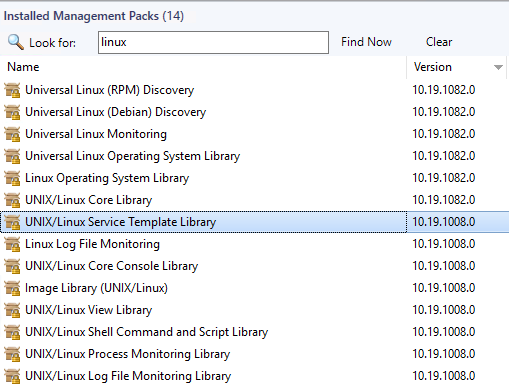
- Verify pre-reqs – SCOM Linux Management packs for Linux/Universal Linux (2019 @ 10.19.1082.0), UNIX/Linux Log File monitoring (2019 @ 10.19.1008.0)
- Linux server has SCOM Agent installed, configured, and updated (sudoers configured) – GUI blog here
- Use docs.microsoft.com article
Load Sample Log monitoring pack
This piece is missing in the doc, but the content development team has this covered in a subsequent docs article. We need to load a sample log monitoring pack to the SCOM management group, so we can test functionality.

Grab the file here, otherwise you can copy/paste from the docs article pretty easily.
Verify OMED service running on Management Server
It’s now time to enable the OMED service on the management server, and we can start with the docs subsection
Navigation steps from SCOM console (GUI)
- From the Operations console, go to Monitoring>Operations Manager>Management Server>Management Servers State.
- Select the management server in the Management Servers state.
- From Tasks, select Health Service Tasks>Enable System Center OMED Server
Steps to set/start service PowerShell (as admin)
# Verify service startup type is automatic
get-Service OMED | select -property Name,Starttype
# Example output
PS C:\Users\admin> Get-Service OMED | select -property name,starttype
Name StartType
—- ———
OMED Automatic
# Set startup type
# Start OMED service on SCOM management server (MS)
start-service OMED
Now we’re ready to test the UNIX agent!
Configure SCOM/OMSagent on Linux server
And now it’s time to switch to the agent side. I’m assuming that you’ve already configured the SCOM agent on the Linux server. So it’s time to verify the SCOM and OMSAgent is configured and working. Let’s go back to the docs subsection for our sanity check, because we need to create folders, and set ownership, etc.
Create files and set permissions
mkdir /etc/opt/microsoft/omsagent/scom/conf/omsagent.d
mkdir /etc/opt/microsoft/omsagent/scom/certs
mkdir /var/opt/microsoft/omsagent/scom/log
mkdir /var/opt/microsoft/omsagent/scom/run
mkdir /var/opt/microsoft/omsagent/scom/state
mkdir /var/opt/microsoft/omsagent/scom/tmp
mkdir /home/omsagent/fluent-logging
# NOTE – This location is flexible for the path to use for log file position files
chown omsagent:omiusers state
chown omsagent:omiusers run
chown omsagent:omiusers log
chown omsagent:omiusers tmp
chown omsagent:omiusers /home/omsagent/fluent-logging
Verify SCOM certificate
Configuring FluentD requires the SCOM management server (MS) has signed the certificate on the UNIX server. The docs article tells you to generate a new certificate for FluentD, which requires the management server.
Overview
Sign the certs on the agent > copy to MS > sign > copy back to agent
Step by step instructions
- Generate certs
/opt/microsoft/scx/bin/tools/scxsslconfig -c -g /etc/opt/microsoft/omsagent/scom/certs/
2. Rename certificates
cp -p omi-host-server.domain.pem to scom-cert.pem
cp -p omikey.pem to scom-key.pem
3. Copy certs to MS (sftp/ssh via WinSCP, or your app of choice)
4. Sign certs on MS via scxcertconfig -sign
Open PowerShell (as admin)
Go to your SCOM management server directory (hopefully d:)
cd ‘D:\Program Files\Microsoft System Center\Operations Manager\Server’
scxcertconfig -sign scom-cert.pem
scxcertconfig -sign scom-key.pem
5. Copy certs back to agent from MS (sftp/ssh via WinSCP, or your app of choice)
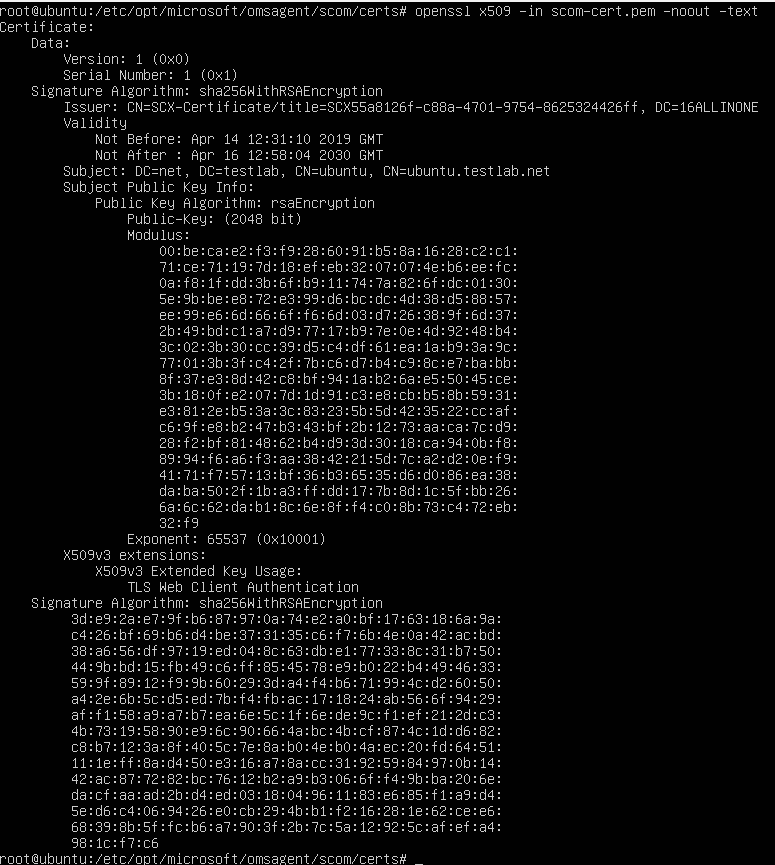
6. Verify the SCOM certificate shows your Management Server (MS) in the DC= line in the certificate
openssl x509 -in scom-cert.pem -noout -text
7. Restart omsagent
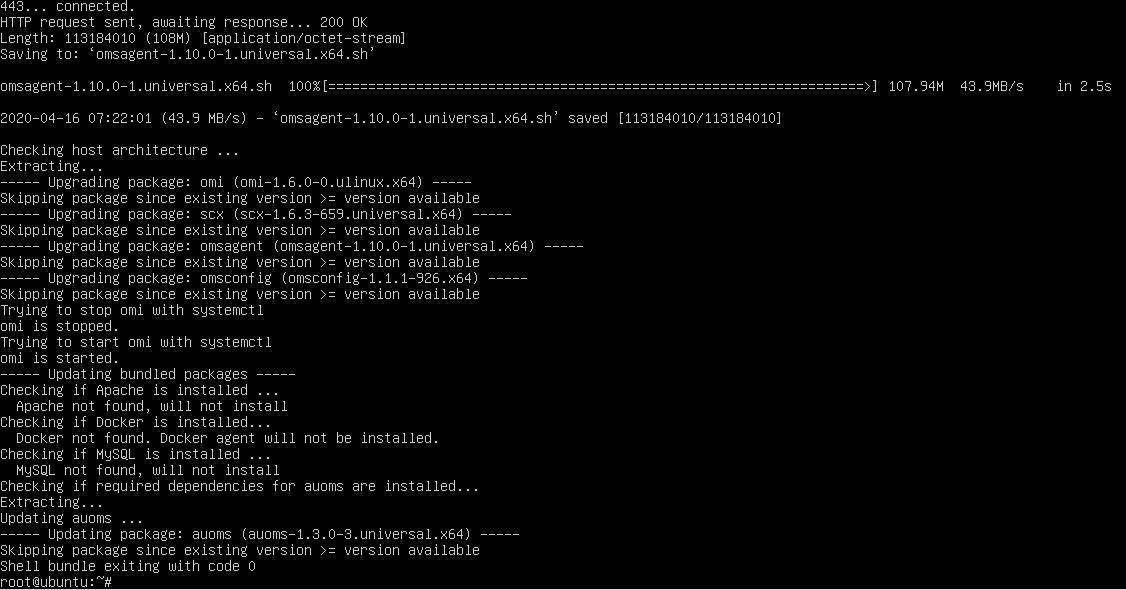
As the ALLINONE server is one of my 2019 SCOM labs, I can verify that my cert is now signed by the management server (MS). Time to load the certificate, and then restart the agent to see if we have any errors
# Restart Agent
/opt/microsoft/omsagent/bin/service_control restart
Verify omsagent.log errors
Verify any errors from the omsagent.log
Depending on where you are with your UNIX/Linux commands, this may help provide some context or use case examples.
My example –
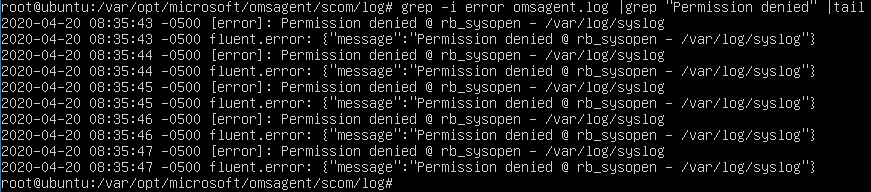
First error after restart was ‘permission denied’. FluentD runs under the omsagent ID, and needs to have access to whatever log – at least read (4). For the syslog example, I made omsagent the owner, and omiusers the group. The smarter, security hat on, choice is to leave as root and make it read capable, or add omsagent to the root group

Search /var/opt/microsoft/omsagent/scom/log/omsagent.log for errors. Commands build on another, from simpler to more complex. Don’t worry if UNIX/Linux is new, I’m all about examples, so hope that helps bridge the gap!
# Tail omsagent.log for progress
# Option 1 Continual output updates from file
tail -f /var/opt/microsoft/omsagent/scom/log/omsagent.log
# Option 2 – get last 10 lines
tail /var/opt/microsoft/omsagent/scom/log/omsagent.log
# Option 3 – get last 100 lines
tail -100 /var/opt/microsoft/omsagent/scom/log/omsagent.log
# Option 4 – Get a little fancier – search for a string
grep string /var/opt/microsoft/omsagent/scom/log/omsagent.log
# Option 5 – Specific example = error, case insensitive (-i)
grep -i error /var/opt/microsoft/omsagent/scom/log/omsagent.log
# Option 6 – egrep strings and -v to exclude what you don’t want to see
grep -i error /var/opt/Microsoft/omsagent/scom/log/omsagent.log |egrep -v “Permission denied|stacktrace”
Verify FluentD config files
Verify FluentD conf files and omsagent.conf has INCLUDE line
The INCLUDE lines allows a directory for a ‘Gold depot’ to control what log files are monitored on destination linux servers. The goal is a standard repository (gold depot ) to simply copy the conf file you want for logfile/app/daemon, restart agent, and you’re off to the races monitoring that log file.
Verify omsagent.conf includes directory
grep -i include /etc/opt/Microsoft/omsagent/scom/conf/omsagent.conf
# If there’s output, make sure that omsagent.d path exists
# Verify permissions show omsagent:omiusers
ls -al /etc/opt/Microsoft/omsagent/scom/conf | grep omsagent
10. Back to step 8’s problem, to fix the FluentD conf files, so we can test! Step 9 verified that FluentD is configured via the omsagent.conf, and also for specific configuration files (.conf) in omsagent.d directory.

Next, we need to restart the agent to verify configuration, and any errors are seen on the FluentD side.
My error for ‘out_scom’ plugin was already used by some other test conf files.
grep -i error /var/opt/Microsoft/omsagent/scom/log/omsagent.log |grep “Permission denied” |tail
Example of omsagent.log where we have traced an event for our mylog
Mike explained that my error was due to having multiple FluentD conf files using the same buffer path for ‘out_scom’. I searched the conf files to see who had ‘out_scom’ and removed one of my old test files from months back when I was testing the feature.
# Example of errors in the omsagent.log

Don’t forget to restart the omsagent for reading in the new file changes
# Restart Agent
/opt/microsoft/omsagent/bin/service_control restart
I’ll cover building a fluentd conf file in another blog post for brevity.
Time to test for alerts!
Time to test our FluentD conf file and append entries into the log file!
Starting simple again
# Options
echo test >> /var/log/mylog
echo 911 error >> /var/log/mylog
# Echo entries into test logfile to mimic syslog or messages
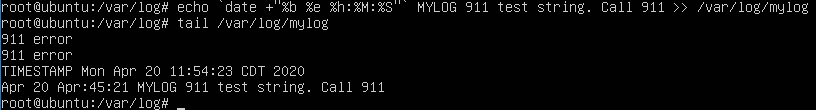
echo `date +”%b %e %H:%M:%S”` MYLOG 911 test string. Call 911
# Verify
tail /var/log/mylog
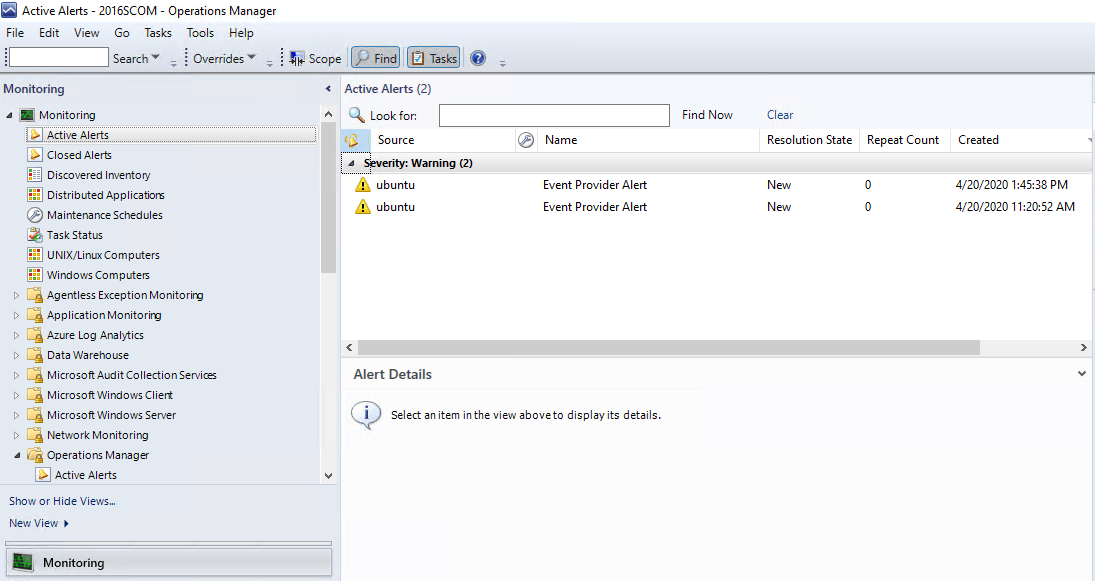
Switch over to SCOM management server, and look for alerts
Navigate to the Monitoring Tab > Active alerts

References for more information
In case you need a refresher on all the date options… Found CyberCiti FAQ helpful

All because the goal is to make the echo statement better for testing closer test/UAT examples on string matches, etc.
echo `date +”%b %e %H:%M:%S”` MYLOG 911 test string. Call 911
And what does it look like?