NiCE VMware addendum

'NiCE VMware addendum' enhances VMware monitoring, tuning alerts to 'manual intervention' required alerting. 
‘NiCE VMware addendum’ enhances VMware monitoring, tuning alerts to ‘manual intervention’ required alerting.

‘NiCE VMware addendum’ enhances VMware monitoring, tuning alerts to ‘manual intervention’ required alerting. The NiCE folks have been around for some time as a trusted Microsoft partner, creating additional monitoring functionality across Microsoft products.  Having completed a number of projects implementing the VMware pack, it’s time to share the configuration and alert report capabilities.


Quick Download HTTPS://GITHUB.COM/THEKEVINJUSTIN/NICEVMWAREADDENDUM/

Changes to Nice vmware pack

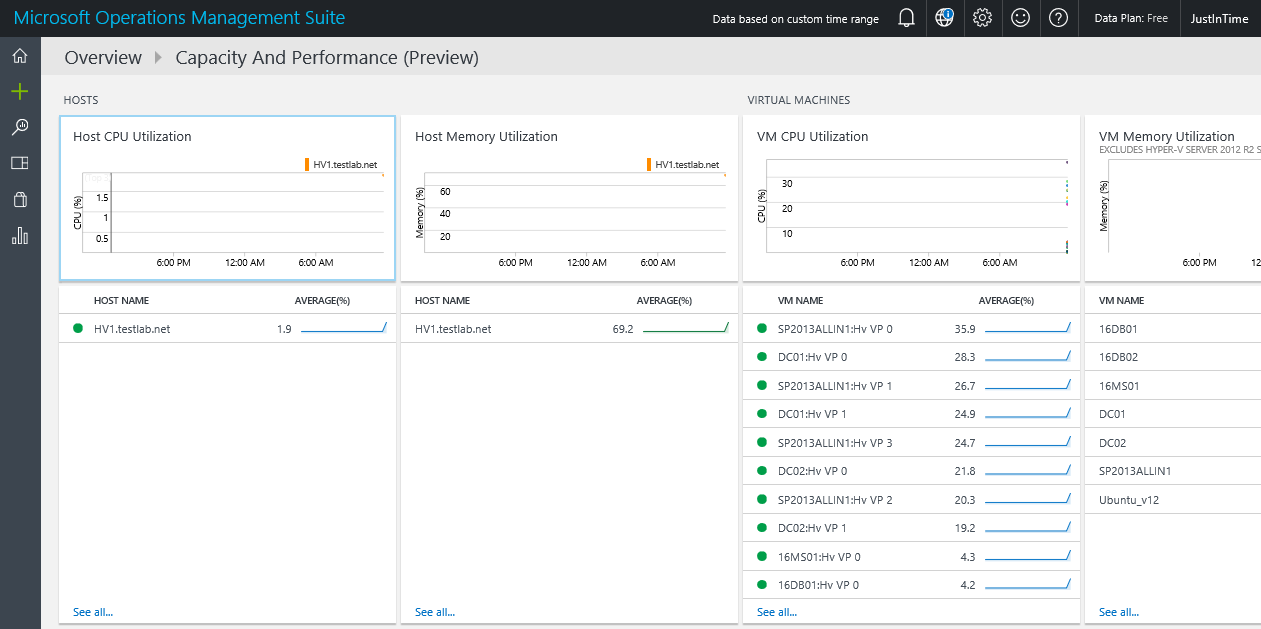
Key breakdown of VMware ESX environment monitoring

NiCE VMware monitoring features for ESX, vSphere, vSAN environments


Adjustments to vendor pack to further the mantra ‘alert when manual intervention required’.

Set monitor alerts to multiple samples over an hour (i.e. compute and performance of ESX environment)

Reports by team (requires regular expression updates for environment servers owned by each team)

Monitor reset logic, and service monitorType (count logic for X failures over Y time, before alert)

Overrides to change vendor pack provided discoveries, rules, monitors

Remove alert noise for unmanaged objects in ESX environment


Customize pack for environment

Customize the ‘NiCE VMware addendum’ pack for specific environment. This means updating group discoveries, and GUIDs for group specific overrides.  Further updates are required to update server naming conventions for team virtualization reports.

Classes/groups created for pack
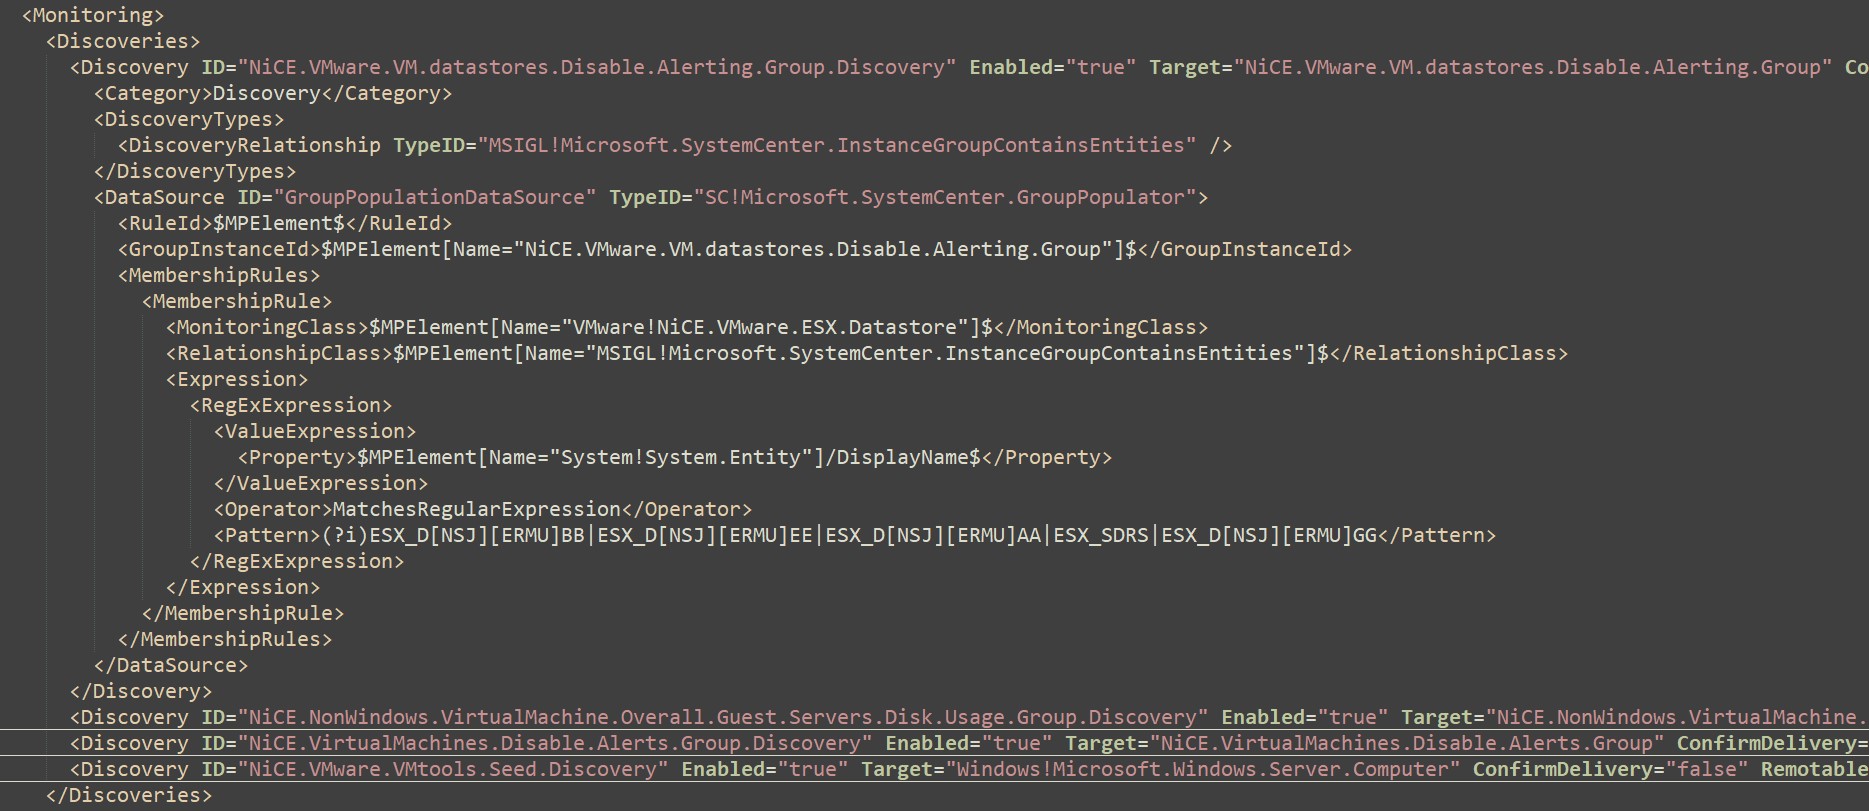
VMware classes included for additional customization.

Discoveries

Breakout of Discoveries that need pattern updates to match

Find/Replace ##ESXHostDataStoreNamingConventions## with names to exclude

Example of regular expressions for multiple customers

VMware Group Seed Classes defined in the addendum.


Update disable guest machine alerts

Disable guest machines in ESX environment to disable alerts.

Find ##ESXGuestServersDiskUsageNamingConventions##

Replace with relevant guest naming conventions


Example template/guest/virtual machine names typically disabled

Update discovery to disable alerts on object names of virtual machines in ESX environment.


Service MonitorType

Service MonitorType adds Samples and Intervals to alert after consecutive failures (x failures in y minutes then alert )

VMware service MonitorType defined in the addendum.

Rules, Monitors, Recoveries

List of workflows used to troubleshoot/resolve problems

VMware addendum rules, VMTools monitor, and recovery components included.


Documentation

NiCE VMware management pack https://www.nice.de/nice-vmware-mp/


Get to know your monitor

Ever need to disable a specific monitor?

I know I get tired of clicking through the console, maybe you do too?
Do you know the Monitor name and class?
If yes, then you can enable/disable monitors from PowerShell


So let’s get started.

From your management server, you can run SCOM commands as your ID (assuming your ID is set up in SCOM)


This example has 2 purposes:

  1. SQL2016 SP1 does NOT populate the proper fields, and will be fixed in SP2 per the SQL Engineering blog (Look at comments section – blog here)
  2. Tired of the warning alerts in my SCOM console


Find the monitors

$Monitor = get-scommonitor | where { $_.DisplayName -like “Service Pack Compliance” } | where { $_.Name -like “*Microsoft.SQLServer.2016.DBEngine*” }


Let’s focus for a second on some differences, and how you can interchange the two depending on what information you know

DisplayName attribute is what you see in the console (note the spaces)

Name attribute typically has dots for the spaces


Override a class

Disable-SCOMMonitor -Class $Class -ManagementPack $MP -Monitor $Monitor

Just in case you need to undo the override

Enable-SCOMMonitor -Class $Class -ManagementPack $MP -Monitor $Monitor


Override a group

$Group = (Get-SCOMGroup -DisplayName “Group*”)


# Enable the group

Enable-SCOMMonitor -Group $Group -ManagementPack $MP -Monitor $Monitor


# Disable the group

Disable-SCOMMonitor -Group $Group -ManagementPack $MP -Monitor $Monitor


Reference Links

Disable-SCOMMonitor https://docs.microsoft.com/en-us/powershell/systemcenter/systemcenter2016/operationsmanager/vlatest/disable-scommonitor

Enable-SCOMMonitor https://docs.microsoft.com/en-us/powershell/systemcenter/systemcenter2016/OperationsManager/vlatest/Enable-SCOMMonitor

PowerShell Rule and Monitor Template packs MP including fragments


Hit the easy button!


For all those diehard SCOM Console MP authoring folks, don’t forget about Wei Lim’s blogs to help add PowerShell script functionality into rules and monitors.


PowerShell Rules Blog https://blogs.msdn.microsoft.com/wei_out_there_with_system_center/2015/09/28/opsmgr-new-sample-powershell-collection-rule-wizards-in-the-ops-console/

PowerShell Monitor blog https://blogs.msdn.microsoft.com/wei_out_there_with_system_center/2015/07/09/opsmgr-new-sample-wizard-to-create-powershell-monitors-in-the-ops-console/

Performance Data blog https://blogs.msdn.microsoft.com/wei_out_there_with_system_center/2015/10/03/opsmgr-collecting-performance-data-using-a-powershell-script-collection-rule-created-from-a-wizard/

Download Rule https://gallery.technet.microsoft.com/Sample-Management-Pack-e48040f7

Download Monitor https://gallery.technet.microsoft.com/Sample-Management-Pack-17b76379


If authoring with Visual Studio or Notepad++, don’t forget Holman’s MP fragments!

Discover Class = Class.And.Discovery.Script.PowerShell.mpx

Monitor Timed Script PowerShell = Monitor.TimedScript.PowerShell.mpx

Monitor Timed Script SQL Query PowerShell = Monitor.TimedScript.PowerShell.SQLQuery.mpx

PowerShell Performance Rule = Rule.Performance.Collection.PowerShellScript.mpx


Download fragments here


Happy MP Authoring!

Optimize SQL for SCOM

Maybe I’m old school, but do you ever feel like optimizing SQL is like playing a video game?

Keep on shooting, hopefully you don’t hit your thrusters and drift and then die!


Does your SQL DBA Team (or did you):

NTFS Allocation Unit set to 64KB for the SQL Server drives

Dedicate memory for the OS (set SQL to use max memory)

Set autogrow to be greater than 1 MB?

MaxDOP (degrees of parallelism)

TempDB’s are on separate mounts (and match the number of cores)

Database and log files are on separate mounts

Backup SQL Server encryption keys

Disable XpCommandShell


Most of the documentation can be had from a single link

https://docs.microsoft.com/en-us/system-center/scom/plan-sqlserver-design?view=sc-om-1711


Disable XpCommandShell https://docs.microsoft.com/en-us/sql/relational-databases/system-stored-procedures/xp-cmdshell-transact-sql


Setting up OMS Capacity and Performance

Setting up OMS Capacity and Performance


Update 18 Dec 2023 – Solution retired in 2021 with OMS sunset.  

https://github.com/uglide/azure-content/blob/master/articles/log-analytics/log-analytics-add-solutions.md Repository archived by the owner on Feb 1, 2021. It is now read-only.


Do you know what your HyperV hosts are doing?

Not a HyperV fan, there’s a VMWare solution also here


Documentation https://docs.microsoft.com/en-us/azure/log-analytics/log-analytics-capacity

https://github.com/uglide/azure-content/blob/master/articles/log-analytics/log-analytics-capacity.md


Capacity dashboard

Capacity and performance preview summary

Details

OMS dashboard
OMS dashboard


Setting up OMS Capacity and Performance

Already have the dashboard setup?  Perhaps this will help troubleshoot

Do you have network connectivity, or is a proxy required?


Troubleshooting dashboard

Firewall https://docs.microsoft.com/en-us/azure/log-analytics/log-analytics-proxy-firewall
Windows Agents https://docs.microsoft.com/en-us/azure/log-analytics/log-analytics-windows-agents


Verify Operations Manager event log on local agent, then filter for error events and/or EventID 4506.  Look for dates/times to see when events started.

Example Event ID 4506 details the Capacity and Performance Solution, citing ‘Microsoft.IntelligencePacks.CapacityPerformance.Collector’.

Operations Manager Event Log, Event ID 4506 examples


Additional options

  1. Search LAW (Log Analytics workspace) logs

https://github.com/uglide/azure-content/blob/master/articles/log-analytics/log-analytics-log-searches.md

OMS Log search screenshot


2. Verify no proxy is set up (unless your network requires this)

OMSAgent proxy setting


3. 4506’s result from too many workflows sending data from MS to DB’s (OpsMgr and DW).  Additionally, 4506 events can be communication issues from MS to DB server(s).   Lastly, use TLS1.2 configuration as a best practice to enforce encryption from MS to SQL communication.  Beyond encryption, TLS may be a culprit if AlwaysOn or SQL clusters are involved, particularly as the SCOM console connections fail as SDK cannot talk with SQL side.  See Kevin Holman’s blog for additional TLS1.2 information and setup.

TLS blog https://kevinholman.com/2018/05/06/implementing-tls-1-2-enforcement-with-scom/


Documentation

Learn article https://learn.microsoft.com/en-us/answers/questions/212007/scom-errors-no-data-in-summary-performance-dashboa
TechNet blog https://social.technet.microsoft.com/Forums/ie/en-US/10b38121-b0e1-43ec-bf3a-d22ae9ef0220/event-4506-data-was-dropped-due-to-too-much-outstanding-data-in-rule
MS RMSe https://www.system-center.me/opsmgr/event-4506-and-new-root-management-server-rms-management-server-ms/