Logical Disks Dynamic Group

So what do you do when a team comes to you and asks for different values for logical disk alerts?


Work smarter vs. harder!


Harder

Use Explicit groups

As an Admin, someone should not have to update groups every time a server or app changes in the environment.


Smarter

Use Dynamic groups

One better, use regular expressions (see Kevin Holman’s blog if you need a refresher)


Great background information

Holman had a great article to make groups of logical disks

TechNet had some good example references in this wiki

Forum article where John Joyner (MVP) listed a way to make a dynamic group

Groups can consist of objects in a primary class and also includes Windows Computer attribute


How can this apply to  your environment?

Is there a unique attribute for the class you’ve chosen, or possibly to include Windows Computer class properties?

In my experience, the Windows Computer Class can be utilized to better specify the criteria, using Principal Name, NetBIOS name, etc.)


Let’s begin to see walk through the Logical Disk class attributes, and understand that we can look at the class, and the Windows Computer class.


From the SCOM Console

Click on the Monitoring Tab

Click on Discovered Inventory

On the Tasks pane (right hand pane), click on change target type

I chose Windows Server 2016 Logical Disk (corresponding for 2008,12 class structures exist)


Are there any unique class/object properties where we can differentiate?

Path stands out, possibly size

Display Name/Device Identifier/Device Name are of course the drive letter


Create a Dynamic group

From the SCOM Console

Click on the Authoring Tab

Click on Groups

On Task pane, click on ‘Create New group’


Name the group

Recommend naming convention – my example is TEAM Logical Disk group (where TEAM could be SQL, SharePoint, Exchange, Skype, etc.)

Don’t forget to add description comments to help the next guy who’s tracking down details!

Create Management pack, or add to the Team’s overrides or customizations management pack.


Click Next twice (to get to Dynamic Members tab)

Click Create/Edit Rules


Choose class

Our example was ‘Windows Server 2016 Logical Disk’

Click Add


Click the Property Drop down


Note the options – and refer back to your notes in the Discovered Inventory from the Monitoring Tab

The three D’s in the middle – Device Identifier, Device Name, and Device Description were all the drive letter

I chose Device Name as it seemed the logical choice


Click Insert + to add another property

Click again on the Class properties

Select the bottom choice – (Host=Windows Computer)

Select Principal name

In my case, the servers met a specific naming convention for the server name


In the Operator Column, choose ‘Matches regular expression’

In the Value field, enter your regular expression


My example is (?i)16[md]

Go back to my Discovered inventory output


Dissect the regular expression

(?i) case inclusive (don’t care upper or lower case – back to Unix roots!)

16m or 16d is in the server name


Click OK

Click Next twice to create group (and bypass Sub Groups, Excluded Members)

Click Create Group

Click Close


Verify expression

From the Authoring pane

Click on the Group and either right click ‘View Group members’, or in the task pane, click ‘View Group members’

Practice using regular expressions to get the desired results!


Now it’s time to go off and override the monitor for the newly created group!


OMS/Advisor Event ID 55002


This article is written for the Gateway CommunicationSecurityException event

At first I thought maybe this was TLS1.2 enabling, but backed off the change, the events kept pouring in every 5 minutes.

Tried to reconfigure the OMS/Advisor environment, and voila! Error resolved


Let’s go through the steps to re-configure the Operations Management Suite (OMS) in SCOM


Reconfigure OMS

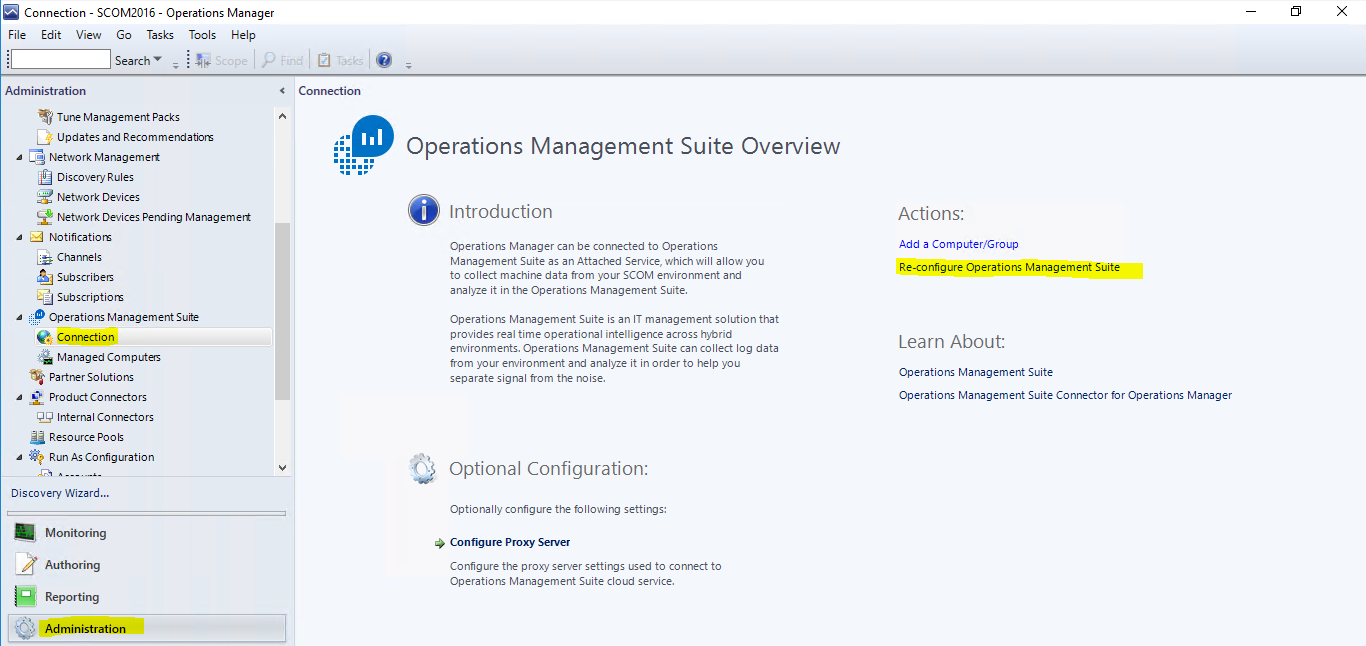
  1. From the SCOM Console, click on Administration tab
  2. Expand Operations Management Suite (Advisor on 2012R2)
  3. Click on the Connection
  4. On the center pane, click on Re-configure Operations Management Suite


5. Add any trusted sites to IE if there are pop-ups

I had 2 missing websites

Secure.aadcdn.microsoftonline-p.com

az416426.vo.msecnd.net

( I hit Previous and next to verify the wizard would pass with the hopes the attempt would retry)

6. Exit the Reconfigure wizard to get a retry (then the second website popped up as an untrusted site)

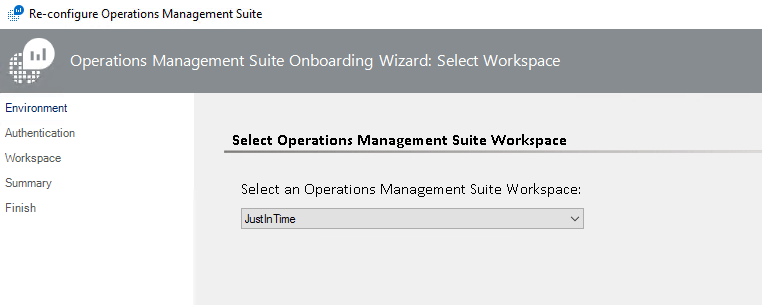
7. Enter credentials to your OMS environment


Connection to OMS successful


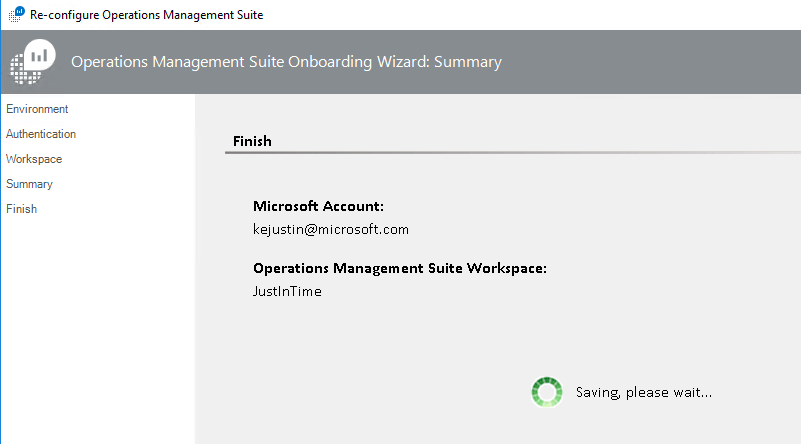
Click Next twice

Reconfigure success

Click Close


Verify Event Log

Verify Operations Manager Event Log has no new events (this check runs every 5 minutes by default)

get-eventlog -logname “Operations Manager” | ? { $_.EventID -match 55002 } | select-object -last 2


Event ID 55002 from Operations Manager Event Log

Log Name:      Operations Manager
Source:        Advisor
Date:          12/11/2017 2:15:20 PM
Event ID:      55002
Task Category: None
Level:         Warning
Keywords:      Classic
User:          N/A
Computer:      16MS01.testlab.net
Description:
Failed to synchronize the latest Management Package information from Advisor Cloud service. Wait for the next cycle to retry. Reason: Microsoft.SystemCenter.Advisor.Common.WebService.GatewayCommunicationSecurityException: Message security was invalid for the connection with web service when performing Get Intelligence Packs with client specified versions —> System.ServiceModel.Security.MessageSecurityException: An unsecured or incorrectly secured fault was received from the other party. See the inner FaultException for the fault code and detail. —> System.ServiceModel.FaultException: ID3242: The security token could not be authenticated or authorized.
— End of inner exception stack trace —

Server stack trace:
at System.ServiceModel.Channels.SecurityChannelFactory`1.SecurityRequestChannel.ProcessReply(Message reply, SecurityProtocolCorrelationState correlationState, TimeSpan timeout)
at System.ServiceModel.Channels.SecurityChannelFactory`1.SecurityRequestChannel.Request(Message message, TimeSpan timeout)
at System.ServiceModel.Dispatcher.RequestChannelBinder.Request(Message message, TimeSpan timeout)
at System.ServiceModel.Channels.ServiceChannel.Call(String action, Boolean oneway, ProxyOperationRuntime operation, Object[] ins, Object[] outs, TimeSpan timeout)
at System.ServiceModel.Channels.ServiceChannel.Request(Message message, TimeSpan timeout)

Exception rethrown at [0]:
at System.ServiceModel.Security.IssuanceTokenProviderBase`1.DoNegotiation(TimeSpan timeout)
at System.ServiceModel.Security.IssuanceTokenProviderBase`1.GetTokenCore(TimeSpan timeout)
at System.IdentityModel.Selectors.SecurityTokenProvider.GetToken(TimeSpan timeout)
at System.ServiceModel.Security.Tokens.IssuedSecurityTokenProvider.GetTokenCore(TimeSpan timeout)
at System.IdentityModel.Selectors.SecurityTokenProvider.GetToken(TimeSpan timeout)
at System.ServiceModel.Security.SecurityProtocol.TryGetSupportingTokens(SecurityProtocolFactory factory, EndpointAddress target, Uri via, Message message, TimeSpan timeout, Boolean isBlockingCall, IList`1& supportingTokens)
at System.ServiceModel.Security.TransportSecurityProtocol.SecureOutgoingMessageAtInitiator(Message& message, String actor, TimeSpan timeout)
at System.ServiceModel.Security.TransportSecurityProtocol.SecureOutgoingMessage(Message& message, TimeSpan timeout)
at System.ServiceModel.Security.SecurityProtocol.SecureOutgoingMessage(Message& message, TimeSpan timeout, SecurityProtocolCorrelationState correlationState)
at System.ServiceModel.Channels.SecurityChannelFactory`1.SecurityRequestChannel.Request(Message message, TimeSpan timeout)
at System.ServiceModel.Dispatcher.RequestChannelBinder.Request(Message message, TimeSpan timeout)
at System.ServiceModel.Channels.ServiceChannel.Call(String action, Boolean oneway, ProxyOperationRuntime operation, Object[] ins, Object[] outs, TimeSpan timeout)
at System.ServiceModel.Channels.ServiceChannelProxy.InvokeService(IMethodCallMessage methodCall, ProxyOperationRuntime operation)
at System.ServiceModel.Channels.ServiceChannelProxy.Invoke(IMessage message)

Exception rethrown at [1]:
at System.Runtime.Remoting.Proxies.RealProxy.HandleReturnMessage(IMessage reqMsg, IMessage retMsg)
at System.Runtime.Remoting.Proxies.RealProxy.PrivateInvoke(MessageData& msgData, Int32 type)
at Microsoft.AttachedServices.WebService.IIntelligenceService.GetIntelligencePacksInfo(ClientProperties clientProperties)
at Microsoft.SystemCenter.Advisor.Core.WebService.WebServiceCallHelper.CallWebService[T](Func`1 webServiceCall, String webServiceDescription)
— End of inner exception stack trace —
at Microsoft.SystemCenter.Advisor.Core.WebService.IntelligenceServiceClient.CallWebServiceWithRetry[T](Func`2 function)
at Microsoft.SystemCenter.Advisor.Core.WebService.IntelligenceServiceClient.GetIntelligencePacksInfo(ClientProperties clientProperties)
at Microsoft.SystemCenter.Advisor.Core.IntelligencePackWriteAction.UpdateIntelligencePacks()

Use DWdataRP utility on SCOM2016

Extra, Extra, read all about it!   Updated 24 June 2022

The DWdataRP utility works on SCOM2016+ 


This tool has been around since SCOM 2007, and blogged about by Kevin Holman and the SCOM Engineering Team

DW Retention https://kevinholman.com/2010/01/05/understanding-and-modifying-data-warehouse-retention-and-grooming/

Kevin added these –

Here is a link to the original command line tool, DWDATARP:   https://kevinholman.com/files/dwdatarp.zip

Here is a tool which makes this even simpler:  https://www.scom2k7.com/scom-datawarehouse-grooming-settings-super-easy-with-new-gui-tool/

And the latest new tool which adds features and simplicity, which is what I recommend: https://blakedrumm.com/blog/scom-dw-grooming-tool/


DWDataRP https://techcommunity.microsoft.com/t5/System-Center-Blog/Data-Warehouse-Data-Retention-Policy-dwdatarp-exe/ba-p/340415?search-action-id=139683980150&search-result-uid=340415


Download the link at the second link, and save to your machine (x86 or x64)


Run the executable

dwdatarp.exe -s <DB Server Name> -D <DW Database Name>


Example dwdatarp.exe -s 16DB02 -D OperationsManagerDW


Set Data sets according to SLA


Ever need to shorten up your Lab DB, so you can export it, to leverage PowerBI dashboards?


Example Output

PS C:\Users\sqladmin\Documents\DWDataRP\amd64> .\dwdatarp.exe -s 16db02.testlab.net -d OperationsManagerDW
Dataset name Aggregation name Max Age Current Size, Kb
—————————— ——————– ——- ——————–
Alert data set Raw data 180 28,736 ( 0%)
Client Monitoring data set Raw data 30 0 ( 0%)
Client Monitoring data set Daily aggregations 400 136 ( 0%)
Configuration dataset Raw data 400 259,968 ( 3%)
DPM event dataset Raw data 400 0 ( 0%)
DPM.Backup.DataSet Raw data 400 0 ( 0%)
DPM.Backup.DataSet Hourly aggregations 3 0 ( 0%)
DPM.Backup.DataSet Daily aggregations 182 0 ( 0%)
DPM.DiskMgmt.DataSet Raw data 400 0 ( 0%)
DPM.DiskMgmt.DataSet Hourly aggregations 3 0 ( 0%)
DPM.DiskMgmt.DataSet Daily aggregations 182 0 ( 0%)
DPM.DiskUtilization.DataSet Raw data 400 0 ( 0%)
DPM.DiskUtilization.DataSet Hourly aggregations 3 0 ( 0%)
DPM.DiskUtilization.DataSet Daily aggregations 182 0 ( 0%)
DPM.Recovery.DataSet Raw data 400 0 ( 0%)
DPM.Recovery.DataSet Hourly aggregations 3 0 ( 0%)
DPM.Recovery.DataSet Daily aggregations 182 0 ( 0%)
DPM.SLATrend.DataSet Raw data 400 0 ( 0%)
DPM.SLATrend.DataSet Hourly aggregations 3 0 ( 0%)
DPM.SLATrend.DataSet Daily aggregations 182 0 ( 0%)
DPM.TapeUtilization.DataSet Raw data 400 0 ( 0%)
DPM.TapeUtilization.DataSet Hourly aggregations 3 0 ( 0%)
DPM.TapeUtilization.DataSet Daily aggregations 182 0 ( 0%)
Event data set Raw data 100 456,144 ( 5%)
Exchange 2013: Mailbox Database data warehouse dataset Raw data 30 0 ( 0%)
Exchange 2013: Mailbox statistics data warehouse dataset Raw data 30 0 ( 0%)
Exchange 2013: Mailbox statistics data warehouse dataset Daily aggregations 400 0 ( 0%)
Performance data set Raw data 10 216,096 ( 2%)
Performance data set Hourly aggregations 400 5,552,832 ( 61%)
Performance data set Daily aggregations 400 221,312 ( 2%)
Process Monitoring: Performance Metric State data warehouse dataset Raw data 10 0 ( 0%)
Process Monitoring: Performance Metric State data warehouse dataset Hourly aggregations 90 0 ( 0%)
Process Monitoring: Performance Metric State data warehouse dataset Daily aggregations 180 0 ( 0%)
Process Monitoring: Process Health State data warehouse dataset Raw data 10 0 ( 0%)
Process Monitoring: Process Network Ports data warehouse dataset Raw data 10 0 ( 0%)
State data set Raw data 180 6,080 ( 0%)
State data set Hourly aggregations 400 2,335,968 ( 25%)
State data set Daily aggregations 400 99,840 ( 1%)


Commands to run to clean up the warehouse…

.\dwdatarp.exe -s 16db02.testlab.net -d OperationsManagerDW -ds Performance -a Hourly -m 60
.\dwdatarp.exe -s 16db02.testlab.net -d OperationsManagerDW -ds State -a Hourly -m 60
.\dwdatarp.exe -s 16db02.testlab.net -d OperationsManagerDW -ds event -a raw -m 30

Example Output
PS C:\Users\admin\Documents\DWDataRP\amd64> .\dwdatarp.exe -s 16db02.testlab.net -d OperationsManagerDW -ds Performan
ce -a Hourly -m 60
Max data age set to 60 on dataset “Performance data set” aggregation type “Hourly aggregations”
PS C:\Users\admin\Documents\DWDataRP\amd64> .\dwdatarp.exe -s 16db02.testlab.net -d OperationsManagerDW -ds State -a
Hourly -m 60
Max data age set to 60 on dataset “State data set” aggregation type “Hourly aggregations”
PS C:\Users\admin\Documents\DWDataRP\amd64> .\dwdatarp.exe -s 16db02.testlab.net -d OperationsManagerDW -ds event -a
raw -m 30
Max data age set to 30 on dataset “Event data set” aggregation type “Raw data”


Don’t forget to execute cleanup

–This will manually run grooming for this dataset
DECLARE @DatasetId uniqueidentifier
SET @DatasetId = (SELECT DatasetId FROM StandardDataset WHERE SchemaName = ‘Alert’)
EXEC StandardDatasetGroom @DatasetId

–This will manually run grooming for this dataset
DECLARE @DatasetId uniqueidentifier
SET @DatasetId = (SELECT DatasetId FROM StandardDataset WHERE SchemaName = ‘Event’)
EXEC StandardDatasetGroom @DatasetId

–This will manually run grooming for this dataset
DECLARE @DataSetId uniqueidentifier
SET @DataSetId = (SELECT DatasetId FROM StandardDataset WHERE SchemaName = ‘Perf’)
EXEC StandardDatasetGroom @DataSetId

–This will manually run grooming for this dataset
DECLARE @DataSetId uniqueidentifier
SET @DataSetId = (SELECT DatasetId FROM StandardDataset WHERE SchemaName = ‘State’)
EXEC StandardDatasetGroom @DataSetId

Exchange Message Queue Monitoring

Q ?

Hopefully something else popped into your mind, not Star Trek – The Next Generation


How about monitoring a message queue?


This will help you monitor specifically Exchange 2013-2016 queue changes (state or message count beyond a value)


Just specify the queue and encapsulate into a monitor

OR… download the MP Fragment here

############################################################

# Test Queues

#Lab environment

#$queue1 = “Submission”
#$queue2 = “Submission2”

$queue1 = “CompanyName365-mail-onmicrosoft-com.mail.protection.outlook.com”
              $queue2 = “clustered.testlab.net”

##################################################################
# 1. How to monitor the status of the queues below (when the status is “retry” they need alert)

$SPEvent = ( get-queue | where { $_.NextHopDomain -like “$queue1” } | where { $_.Status -like “Retry” } | measure-object )
$SPEvent2 = ( get-queue | where { $_.NextHopDomain -like “$queue2” } | where { $_.Status -like “Retry” } | measure-object )

#
# 2. To get an alert when a message in any of these queues is stuck for &gt; 5minutes
#

$SPEventStuck = ( get-queue | where { $_.NextHopDomain -like $queue1 } | where { $_.Status -like “Suspended” } | measure-object )
$SPEventStuck2 = ( get-queue | where { $_.NextHopDomain -like $queue2 } | where { $_.Status -like “Suspended” } | measure-object )

# 3. Also need alert and exact count when the message count in the above queue goes beyond 1000

$SPEventMC = ( get-queue | where { $_.NextHopDomain -like $queue1 } | where { $_.MessageCount -gt 1000 } | measure-object )
$MCQ1 = ( get-queue | where { $_.NextHopDomain -like $queue1 } )
$MQ1 = ($MCQ1.MessageCount)

$SPEventMC2 = ( get-queue | where { $_.NextHopDomain -like $queue2 } | where { $_.MessageCount -gt 1000 } | measure-object )
$MCQ2 = ( get-queue | where { $_.NextHopDomain -like $queue2 } )
$MQ2 = ($MCQ2.MessageCount)


Have fun!

Exchange 2013 monitoring Addendum

This is a good source for additional Exchange Server 2013+ monitoring, brought to my attention from Exchange PFE Dave Groll!


See Volkan Coskun’s blog post here

Update 30 Nov 2018

NOTE this content is no longer available – posted Volkun’s custom extension pack on TechNet Gallery here


This will help provide additional visibility to individual objects like Mailbox Databases or Transport Queues that are otherwise hidden in the health sets.

NOTE my Lab environment is Exchange 2016

Get to know your monitor

Ever need to disable a specific monitor?

I know I get tired of clicking through the console, maybe you do too?
Do you know the Monitor name and class?
If yes, then you can enable/disable monitors from PowerShell


So let’s get started.

From your management server, you can run SCOM commands as your ID (assuming your ID is set up in SCOM)


This example has 2 purposes:

  1. SQL2016 SP1 does NOT populate the proper fields, and will be fixed in SP2 per the SQL Engineering blog (Look at comments section – blog here)
  2. Tired of the warning alerts in my SCOM console


Find the monitors

$Monitor = get-scommonitor | where { $_.DisplayName -like “Service Pack Compliance” } | where { $_.Name -like “*Microsoft.SQLServer.2016.DBEngine*” }


Let’s focus for a second on some differences, and how you can interchange the two depending on what information you know

DisplayName attribute is what you see in the console (note the spaces)

Name attribute typically has dots for the spaces


Override a class

Disable-SCOMMonitor -Class $Class -ManagementPack $MP -Monitor $Monitor

Just in case you need to undo the override

Enable-SCOMMonitor -Class $Class -ManagementPack $MP -Monitor $Monitor


Override a group

$Group = (Get-SCOMGroup -DisplayName “Group*”)


# Enable the group

Enable-SCOMMonitor -Group $Group -ManagementPack $MP -Monitor $Monitor


# Disable the group

Disable-SCOMMonitor -Group $Group -ManagementPack $MP -Monitor $Monitor


Reference Links

Disable-SCOMMonitor https://docs.microsoft.com/en-us/powershell/systemcenter/systemcenter2016/operationsmanager/vlatest/disable-scommonitor

Enable-SCOMMonitor https://docs.microsoft.com/en-us/powershell/systemcenter/systemcenter2016/OperationsManager/vlatest/Enable-SCOMMonitor

PowerShell Rule and Monitor Template packs MP including fragments


Hit the easy button!


For all those diehard SCOM Console MP authoring folks, don’t forget about Wei Lim’s blogs to help add PowerShell script functionality into rules and monitors.


PowerShell Rules Blog https://blogs.msdn.microsoft.com/wei_out_there_with_system_center/2015/09/28/opsmgr-new-sample-powershell-collection-rule-wizards-in-the-ops-console/

PowerShell Monitor blog https://blogs.msdn.microsoft.com/wei_out_there_with_system_center/2015/07/09/opsmgr-new-sample-wizard-to-create-powershell-monitors-in-the-ops-console/

Performance Data blog https://blogs.msdn.microsoft.com/wei_out_there_with_system_center/2015/10/03/opsmgr-collecting-performance-data-using-a-powershell-script-collection-rule-created-from-a-wizard/

Download Rule https://gallery.technet.microsoft.com/Sample-Management-Pack-e48040f7

Download Monitor https://gallery.technet.microsoft.com/Sample-Management-Pack-17b76379


If authoring with Visual Studio or Notepad++, don’t forget Holman’s MP fragments!

Discover Class = Class.And.Discovery.Script.PowerShell.mpx

Monitor Timed Script PowerShell = Monitor.TimedScript.PowerShell.mpx

Monitor Timed Script SQL Query PowerShell = Monitor.TimedScript.PowerShell.SQLQuery.mpx

PowerShell Performance Rule = Rule.Performance.Collection.PowerShellScript.mpx


Download fragments here


Happy MP Authoring!

SQL Engineering Blog

hmmmm

Ever wonder when a SQL MP is published?

Wonder no longer, look for the SQL Engineering Blog!


New https://techcommunity.microsoft.com/t5/SQL-Server/bg-p/SQLServer/label-name/SQLReleases

Old – redirect in effect https://blogs.msdn.microsoft.com/sqlreleaseservices/


Verifying Custom MP overrides are valid when updating sealed MP’s

kidraisedhand

I will raise my hand when asked if I prefer Notepad++ for looking at XML (because I can shrink the sections I’m not concerned about).


Using Notepad++ (works best for color and concatenation of XML or quotes in case of syntax errors when editing)


Open Overrides management pack (XML)

Click on the (-) for Manifest

Click on the dash (-) for RelationshipTypes

Click on the dash (-) for each Discovery (if it exists)

simplifyingdiscoveryview


Verify targets exist in MP’s to be updated

Scroll to the right to view the Targets of your Override management pack

simplifyingview


If changes were overrides, look at the Monitor or Rule and verify this is in the pack to be updated

overridesmonitor


To understand which MP is being referenced, look at the example – Windows3!

Scroll to the top of your MP and click on the (+) plus sign to expand manifest

mpreference1


NOTE Windows3 is the server 2016 Monitoring MP

decodingmpreference


Verify your monitor/rule name still exists, and your Override should still apply

In Server Overrides MP, look at the Monitor= section for the Monitor name

verifyoverridemonitorhighlight


Go to the Windows Server 2008 Monitoring MP and look for that monitor

There is no monitor for 2008

notepadmonitortypes


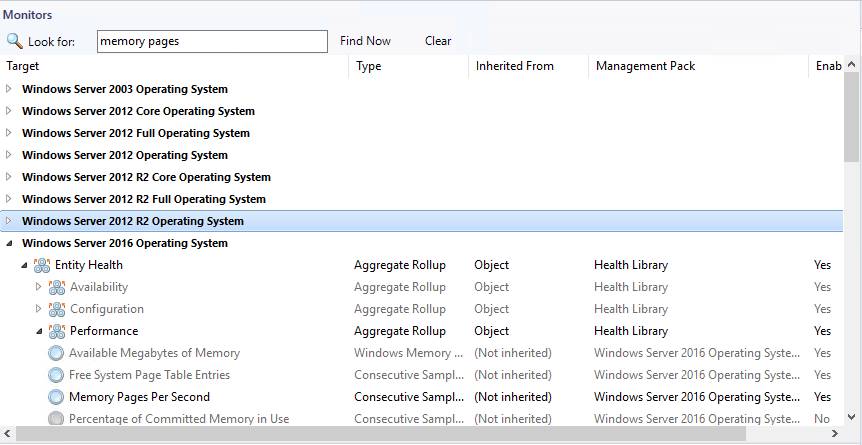
Alternatively, you can look at the SCOM console as well (if MP is installed)

There is NO 2008 Memory Pages per second monitor

 scomconsolemonitorverify


Now to remove the override in our MP

In Notepad++, highlight the MonitorConfigurationOverride section, and delete

monitoroverridehighlight

Rinse and Repeat

Increment the version number and import MP when finished validating overrides.


Troubleshoot Office 365 SCOM MP Run As account

Run As Account

The Office 365 Run As account is used for Proxy access for an HTTPS connection from SCOM MS to Office 365 portal endpoint.

Must be a domain account, not an Azure account (particularly if they ‘re not the same tenant or AAD associated

Service Accounts are recommended to prevent impact should an employee leave


SCOM uses a domain account (example scom_action ID)

Verify that ID is in Azure tenant (contact your Azure Administrator if you don’t have access )

o365applicationazureidverify

To follow best practice, update the Run As account with the service account

o365applicationscomrunascredential


Verify Run As account

On SCOM console that there are no Operations Manager event log 7000 events for the ‘run as’ configured ID

Remote Desktop to SCOM MS Server

Verify if the ‘run as’ ID has a valid password

Look in the Operations Manager Event Log for Event ID 7000

Click on Find

Type in the user’s ID from the ‘run as’ account in SCOM

If no entries found, then ID is successfully authenticating against the domain

If errors found, correct ID/Password