Compare SolarWinds and SCOM

My Big Fat Greek Wedding - we're all just fruits!
My Big Fat Greek Wedding – we’re all just fruits!

I think of My Big Fat Greek wedding to ‘Compare SolarWinds and SCOM’.  The wedding reception, where the father says the root of his daughter, and son-in-law’s last names, are from the greek word for Orange, and Apple.  “so in the end, we’re all fruits”   We are the same but different, where diversity and inclusion is key.  Everyone’s got a voice.  Contribute, don’t consume 🙂


First, I’ve been lucky to administer both tools for Fortune 100 companies (and more tools).  Second, I hope this blog provides some clarification of the strengths, weaknesses, and costs associated with both tools.  Here’s hoping wordpress readers identify with my background – saving money, cutting coupons, looking for on-sale, buy one get one deals.  Thirdly, while everyone’s past experiences may not be the same, cost is still a big factor.  Lastly, proprietary tools, Security, and other requirements can make or break an implementation.


Here’s a link to a PPT built to ‘Compare SolarWinds and SCOM’ feature wise, that goes along with ‘My Big Fat Greek Wedding’ and the fruit.  PPT title ‘better together’, is loaded with links and breaking out key capabilities.


Some items NOT covered in the PPT comparison

Example context – SAW/PAW/Red Forest

Both tools can store credentials within the application, obfuscated.

SCOM allows gMSA’s (managed service accounts) for key services including run as accounts.  View the Monitoring Guys blog plug here for CJ, Scott, and Tyson’s contributions 😛


COST

SolarWinds small enterprise example
Windows Server, SQL licenses (no cost given)

Monitors Windows, Non-Windows, Microsoft products

Community of custom application monitoring

Renewal cost per year in 2020 $48K/year
Add HA for SQL Enterprise licenses is same, where SW HA/High availability is the SolarWinds cost, not compute licenses for Windows Server, SQL
***500 license SAM, VOIP, IPAM, NPM/NCM.
Redesigning licensing to unlimited (site license) was $344K
Wow! Site licenses cost considerably more.
Though for clarification, 500 licenses equates to 500 monitors targeted at 500 servers.
SolarWinds costs broken out by feature

Add unlimited VMAN, DPA, SCM, VNQM adds $256K

Add new SolarWinds features


Migrate functionality to site license ($48K > $344K)

Adding SolarWinds features with site unlimited licenses


SCOM small enterprise example

Windows Server, SQL licenses (no cost given)
No license limitation for products/features used, community built solutions

Monitors Windows, Non-Windows, Microsoft products

Large community of custom application monitoring

No yearly support costs (included with Microsoft support agreement)

SQL Enterprise licenses is same, where SW HA/High availability is the SolarWinds cost, not compute licenses for Windows Server, SQL

ESX monitoring via NiCE VMWare 3rd party pay pack is $10K/year
OpsLogix Teams integration helps with NOC/NOSC/SOC integration
Including NiCE Oracle monitoring $10k/year


I’ll leave the cost comparisons to you.

Securing the Applications and web consoles

SolarWinds (SW)

Secure SW website search, Smart Cards post, 2FA/MFA/RSA post

NPM (now N-Able RMM – Remote Management & Monitoring)

NCM Thwack forum

SCOM web console

Did you know – gMSA’s (managed service accounts) can be used with SCOM, Windows, AD, etc?  Monitoring Guys blog plug here for CJ, Scott, and Tyson 😛

Configuring AD Delegation, Smart cards and SSL certs (Client Certificate Mapping Authentication, IIS configuration, FIPS

Knowledge sources: Learn.Microsoft.Com, TechNet, blogs, STIG Library and more


Vulnerability mitigation

SCOM vulnerability mitigations Blog vuln search, SCOM STIGs plus IIS, Windows Server, SQL, WebServer ALL apply

Solarwinds vulnerability – Trust Center – CVE2023-23836, CVE2021-35211, CVE-2023-33231, all from searches.

NO DISA STIG for SolarWinds, so IIS, Windows Server, SQL, WebServer ALL apply


NOTE: I’ve NOT supported SolarWinds recently to see Security scans for other vulnerabilities and STIG settings (Windows Server, SQL, IIS, Network blog.  STIG dashboard ‘how to’


Licensing

Licensing is a big differentiator cost wise

SolarWinds needs an EA for Windows Server, SQL licenses.

SCOM has been part of the EA (Enterprise agreement) for at least 15+ years (since SCOM2007, if not MOM2005).  Windows Server license (now CPU based), SQL license, however NOT enterprise comes standard.  One reason the System Center suite is successful might be this built-in licensing, as well as the feature depth and cost the tools provide.


Hardware requirements

In my experience interacting with customers, SolarWinds support recommends hardware configuration well above vendor recommendations.  Support recommendations requesting high compute to provide memory level SQL speed and responsive web console.  However, the compute is basically ESX host level compute in the realm of 128GB of memory per server, in High Availability (HA), meaning x4 – 2 servers for 2 sites.

Monitoring tools are rarely Tier1 Applications with respective Service Level Availability (SLA).  Expectation alone presents a disparity, and false impression.  People just see a tool and base on personal experience.

Ferrari vs. GMC Cyclone - fooled you eh
Ferrari vs. GMC Cyclone – fooled you eh

Is it really surprising if one is faster than the other?

SCOM Snapshot Synchronization alerts

Synchronized Swimmers

Updated 4 Apr 2023 with Tyson’s feedback!


First, some background – the Snapshot Synchronization alert just tells you there was a SQL issue running the workflow.

Second, the Snapshot Synchronization alert from a health model perspective, is NOT a critical issue (outage).  Create override severity to 1 (warning) to prevent false wake-up calls.  I’ll get this to my GitHub repo shortly!


Let’s troubleshoot the alert

Start with Tyson’s SCOM Maintenance pack, and run the tasks

Tyson’s SCOM Maintenance pack tasks


Alternative long steps

Login to server with SSMS installed –

Open SSMS > Connect to the SCOM OpsMgr DB > Click on New Query

***NOTE verify database dropdown shows Operations Manager!

Paste SQL query into the query textbox

Select WorkItemName, b.WorkItemStateName, ServerName, StartedDateTimeUtc, CompletedDateTimeUtc, DurationSeconds, ERRORMESSAGE
from cs.WorkItem a , cs.WorkItemState b
where a.WorkItemStateId= b.WorkItemStateId
and WorkItemName = ‘SnapshotSynchronization’

Screenshot

Snapshot Synchronization alert query


Example SQL Output

SQLQueryExecution

WorkItemName WorkItemStateName ServerName StartedDateTimeUtc CompletedDateTimeUtc DurationSeconds ERRORMESSAGE
SnapshotSynchronization Succeeded SCOMV01 2023-01-24 00:26:23.427 2023-01-24 00:27:46.100 83 NULL
SnapshotSynchronization Failed SCOMV02 2023-01-25 00:27:52.363 2023-01-25 00:28:07.520 15
SnapshotSynchronization Succeeded SCOMV00 2023-01-25 21:43:36.540 2023-01-25 21:45:07.947 91 NULL
SnapshotSynchronization Running SCOMV00 2023-01-25 21:45:32.227 NULL NULL NULL

Solution:
The jobs may show Succeeded by the time you login to SQL = EOJ (end of job)

If Failed is latest date/timestamp, re-run the task “Request Snapshot Synchronization” which can be found when we select  “Management Configuration Service Group” in the below mentioned view.

View:

From Monitoring Tab > Click on Operations Manager folder > Click on Management Group Health widget > Highlight unhealthy state from Management Group Functions.

Click on the ‘Request Snapshot Synchronization’ task to execute the Stored Procedure “SnapshotSynchronizationForce” on the OpsMgr DB.


NOTE: There are two tasks with same name but with different targets i.e. ‘Management Configuration Service Group’ and ‘Management Configuration Services’


The other task can be found on below view after selecting the Management Server you want the Task to be executed on

View:

From Monitoring Tab > Expand Operations Manager folder > Expand Management Configuration Service folder > Click on Services State view


Create Override for the alert

To change snapshot monitor to warning

From SCOM Console > Authoring Tab

Expand ‘Management Pack Objects’ > Click on Monitors

In the ‘Look for:’ bar type Snapshot synchronization state and hit enter

Monitor name = Snapshot synchronization state

Right click on monitor > Overrides > Override the monitor > For all objects of class

Click checkbox for Severity > change Critical to Warning

Click Edit – add comment – i.e. date/time changing to warning

Select your override pack > Click OK

Click OK to execute change

Override snapshot monitor to warning


Resources

Tyson’s MonitoringGuys blog for SCOM Maintenance pack – download here

Link to TechNet article


Re-learn an old but still relevant tool – EventLog Explorer


Sometimes we forget about tools that can make things easier.


Time to talk about EventLog Explorer.


Need to repro and test events for an installed program, to see what SCOM will handle?

Read this old mom team blog, courtesy of Kevin Holman blog


I wanted to try it to test fire some events, had a use case where we needed to test Skype events from the SCOM MP


Testing on my SCOM 2016 Management server


Download file, run EventLog Explorer

The Paste icon next to the X is ‘Add to Execution List’ and fills out the bottom pane

The Green Arrow is ‘go’ or execute (similar to PowerShell ISE)


Navigate through the Event Log and Event Source on the left hand pane

Mark events with the checkbox  


Add to Execution


Verify events added to bottom pane

(see my test yesterday for fired, and not fired events from today)


Click Green box with white arrow to fire events, and check Event Viewer


Yesterday’s test


Today’s test


Verify alerting occurred as expected!

Use DWdataRP utility on SCOM2016

Extra, Extra, read all about it!   Updated 24 June 2022

The DWdataRP utility works on SCOM2016+ 


This tool has been around since SCOM 2007, and blogged about by Kevin Holman and the SCOM Engineering Team

DW Retention https://kevinholman.com/2010/01/05/understanding-and-modifying-data-warehouse-retention-and-grooming/

Kevin added these –

Here is a link to the original command line tool, DWDATARP:   https://kevinholman.com/files/dwdatarp.zip

Here is a tool which makes this even simpler:  https://www.scom2k7.com/scom-datawarehouse-grooming-settings-super-easy-with-new-gui-tool/

And the latest new tool which adds features and simplicity, which is what I recommend: https://blakedrumm.com/blog/scom-dw-grooming-tool/


DWDataRP https://techcommunity.microsoft.com/t5/System-Center-Blog/Data-Warehouse-Data-Retention-Policy-dwdatarp-exe/ba-p/340415?search-action-id=139683980150&search-result-uid=340415


Download the link at the second link, and save to your machine (x86 or x64)


Run the executable

dwdatarp.exe -s <DB Server Name> -D <DW Database Name>


Example dwdatarp.exe -s 16DB02 -D OperationsManagerDW


Set Data sets according to SLA


Ever need to shorten up your Lab DB, so you can export it, to leverage PowerBI dashboards?


Example Output

PS C:\Users\sqladmin\Documents\DWDataRP\amd64> .\dwdatarp.exe -s 16db02.testlab.net -d OperationsManagerDW
Dataset name Aggregation name Max Age Current Size, Kb
—————————— ——————– ——- ——————–
Alert data set Raw data 180 28,736 ( 0%)
Client Monitoring data set Raw data 30 0 ( 0%)
Client Monitoring data set Daily aggregations 400 136 ( 0%)
Configuration dataset Raw data 400 259,968 ( 3%)
DPM event dataset Raw data 400 0 ( 0%)
DPM.Backup.DataSet Raw data 400 0 ( 0%)
DPM.Backup.DataSet Hourly aggregations 3 0 ( 0%)
DPM.Backup.DataSet Daily aggregations 182 0 ( 0%)
DPM.DiskMgmt.DataSet Raw data 400 0 ( 0%)
DPM.DiskMgmt.DataSet Hourly aggregations 3 0 ( 0%)
DPM.DiskMgmt.DataSet Daily aggregations 182 0 ( 0%)
DPM.DiskUtilization.DataSet Raw data 400 0 ( 0%)
DPM.DiskUtilization.DataSet Hourly aggregations 3 0 ( 0%)
DPM.DiskUtilization.DataSet Daily aggregations 182 0 ( 0%)
DPM.Recovery.DataSet Raw data 400 0 ( 0%)
DPM.Recovery.DataSet Hourly aggregations 3 0 ( 0%)
DPM.Recovery.DataSet Daily aggregations 182 0 ( 0%)
DPM.SLATrend.DataSet Raw data 400 0 ( 0%)
DPM.SLATrend.DataSet Hourly aggregations 3 0 ( 0%)
DPM.SLATrend.DataSet Daily aggregations 182 0 ( 0%)
DPM.TapeUtilization.DataSet Raw data 400 0 ( 0%)
DPM.TapeUtilization.DataSet Hourly aggregations 3 0 ( 0%)
DPM.TapeUtilization.DataSet Daily aggregations 182 0 ( 0%)
Event data set Raw data 100 456,144 ( 5%)
Exchange 2013: Mailbox Database data warehouse dataset Raw data 30 0 ( 0%)
Exchange 2013: Mailbox statistics data warehouse dataset Raw data 30 0 ( 0%)
Exchange 2013: Mailbox statistics data warehouse dataset Daily aggregations 400 0 ( 0%)
Performance data set Raw data 10 216,096 ( 2%)
Performance data set Hourly aggregations 400 5,552,832 ( 61%)
Performance data set Daily aggregations 400 221,312 ( 2%)
Process Monitoring: Performance Metric State data warehouse dataset Raw data 10 0 ( 0%)
Process Monitoring: Performance Metric State data warehouse dataset Hourly aggregations 90 0 ( 0%)
Process Monitoring: Performance Metric State data warehouse dataset Daily aggregations 180 0 ( 0%)
Process Monitoring: Process Health State data warehouse dataset Raw data 10 0 ( 0%)
Process Monitoring: Process Network Ports data warehouse dataset Raw data 10 0 ( 0%)
State data set Raw data 180 6,080 ( 0%)
State data set Hourly aggregations 400 2,335,968 ( 25%)
State data set Daily aggregations 400 99,840 ( 1%)


Commands to run to clean up the warehouse…

.\dwdatarp.exe -s 16db02.testlab.net -d OperationsManagerDW -ds Performance -a Hourly -m 60
.\dwdatarp.exe -s 16db02.testlab.net -d OperationsManagerDW -ds State -a Hourly -m 60
.\dwdatarp.exe -s 16db02.testlab.net -d OperationsManagerDW -ds event -a raw -m 30

Example Output
PS C:\Users\admin\Documents\DWDataRP\amd64> .\dwdatarp.exe -s 16db02.testlab.net -d OperationsManagerDW -ds Performan
ce -a Hourly -m 60
Max data age set to 60 on dataset “Performance data set” aggregation type “Hourly aggregations”
PS C:\Users\admin\Documents\DWDataRP\amd64> .\dwdatarp.exe -s 16db02.testlab.net -d OperationsManagerDW -ds State -a
Hourly -m 60
Max data age set to 60 on dataset “State data set” aggregation type “Hourly aggregations”
PS C:\Users\admin\Documents\DWDataRP\amd64> .\dwdatarp.exe -s 16db02.testlab.net -d OperationsManagerDW -ds event -a
raw -m 30
Max data age set to 30 on dataset “Event data set” aggregation type “Raw data”


Don’t forget to execute cleanup

–This will manually run grooming for this dataset
DECLARE @DatasetId uniqueidentifier
SET @DatasetId = (SELECT DatasetId FROM StandardDataset WHERE SchemaName = ‘Alert’)
EXEC StandardDatasetGroom @DatasetId

–This will manually run grooming for this dataset
DECLARE @DatasetId uniqueidentifier
SET @DatasetId = (SELECT DatasetId FROM StandardDataset WHERE SchemaName = ‘Event’)
EXEC StandardDatasetGroom @DatasetId

–This will manually run grooming for this dataset
DECLARE @DataSetId uniqueidentifier
SET @DataSetId = (SELECT DatasetId FROM StandardDataset WHERE SchemaName = ‘Perf’)
EXEC StandardDatasetGroom @DataSetId

–This will manually run grooming for this dataset
DECLARE @DataSetId uniqueidentifier
SET @DataSetId = (SELECT DatasetId FROM StandardDataset WHERE SchemaName = ‘State’)
EXEC StandardDatasetGroom @DataSetId

PowerShell Monitor Fragment with Run As

Stop!


Ever need to run a PowerShell command (or script) as a specific ID?

Maybe you need to know when the command fails to catch degraded application health?


Let’s work into the scenario with a MP Fragment


Download the latest fragments here

Load Test MP fragment

Shout to Tyson Paul for his initial MP with 2016, catch his blog here!


This should help speed up building the MP if you have Visual Studio 2013 or 2015 with Visual Studio Authoring Extensions (VSAE).  Read Kevin Holman’s blog if this is new


Download the latest fragments here


Quicker method To build the MP as MP fragment, update the following:

  1. Import MP Fragment into Visual Studio for MP
  2. Replace variables in fragment
    1.   ##CompanyID##
    2.   ##AppName## – LoadTesting
    3.   ##ClassID## – WindowsServer
    4.   ##OSVersion## – 2012 = 6.2, 2012R2 = 2012.R2, 2016 = 100
    5.   ##MPReferenceID## – MWS2M for 2012, MWS2RM for 2012R2
    6.   ##RuleGUID##
  3. Obtain Rule names for Override Targets and Report rule GUID’s for the report parameters section

          get-scomrule | ? { $_.DisplayName -like “System Processor Queue Length*” } | fl ID,DisplayName,Name

          get-scomrule | ? { $_.DisplayName -like “Current Disk Queue Length*” } | fl ID,DisplayName,Name

          get-scomrule | ? { $_.DisplayName -like “Current Disk Queue*” } | fl ID,DisplayName,Name

          get-scomrule | ? { $_.DisplayName -like “Current Dis*k Queue*” } | fl ID,DisplayName,Name

          get-scomrule | ? { $_.DisplayName -like “*Current Disk Queue*” } | fl ID,DisplayName,Name

          get-scomrule | ? { $_.DisplayName -like “*Average Disk Seconds Per Transfer*” } | fl ID,DisplayName,Name

          get-scomrule | ? { $_.DisplayName -like “*Logical Disk Idle Time*” } | fl ID,DisplayName,Name

          get-scomrule | ? { $_.DisplayName -like “*Processor Time Total*” } | fl ID,DisplayName,Name

          get-scomrule | ? { $_.DisplayName -like “*Memory Available Megabytes*” } | fl ID,DisplayName,Name

          get-scomrule | ? { $_.DisplayName -like “*Network Adapter Bytes Total*” } | fl ID,DisplayName,Name

          get-scomrule | ? { $_.DisplayName -like “*Memory Pages per Second*” } | fl ID,DisplayName,Name

          get-scomrule | ? { $_.DisplayName -like “*System Processor Queue Length*” } | fl ID,DisplayName,Name

  1. Save and Import MP into environment
  2. Get Report parameter value for group ID

          get-ScomGroup | ? { $_.DisplayName -like “*Load Testing Group*” } | fl ID,DisplayName

  1. Update ##TargetGroupID##, MP version
    1. Save MP, and import into environment
  2. From SCOM Console, Authoring Tab
    1. Update group with explicit members
    2. Verify Group members
  3. From SCOM Console, Monitoring Tab
    1. Verify Performance view has performance counters
  4. From SCOM Console Reporting Tab (this may take a few minutes to push report to Reporting server)
    1. Open report and run
    2. Export data for analysis

SQL Engineering Blog

hmmmm

Ever wonder when a SQL MP is published?

Wonder no longer, look for the SQL Engineering Blog!


New https://techcommunity.microsoft.com/t5/SQL-Server/bg-p/SQLServer/label-name/SQLReleases

Old – redirect in effect https://blogs.msdn.microsoft.com/sqlreleaseservices/


Verifying Custom MP overrides are valid when updating sealed MP’s

kidraisedhand

I will raise my hand when asked if I prefer Notepad++ for looking at XML (because I can shrink the sections I’m not concerned about).


Using Notepad++ (works best for color and concatenation of XML or quotes in case of syntax errors when editing)


Open Overrides management pack (XML)

Click on the (-) for Manifest

Click on the dash (-) for RelationshipTypes

Click on the dash (-) for each Discovery (if it exists)

simplifyingdiscoveryview


Verify targets exist in MP’s to be updated

Scroll to the right to view the Targets of your Override management pack

simplifyingview


If changes were overrides, look at the Monitor or Rule and verify this is in the pack to be updated

overridesmonitor


To understand which MP is being referenced, look at the example – Windows3!

Scroll to the top of your MP and click on the (+) plus sign to expand manifest

mpreference1


NOTE Windows3 is the server 2016 Monitoring MP

decodingmpreference


Verify your monitor/rule name still exists, and your Override should still apply

In Server Overrides MP, look at the Monitor= section for the Monitor name

verifyoverridemonitorhighlight


Go to the Windows Server 2008 Monitoring MP and look for that monitor

There is no monitor for 2008

notepadmonitortypes


Alternatively, you can look at the SCOM console as well (if MP is installed)

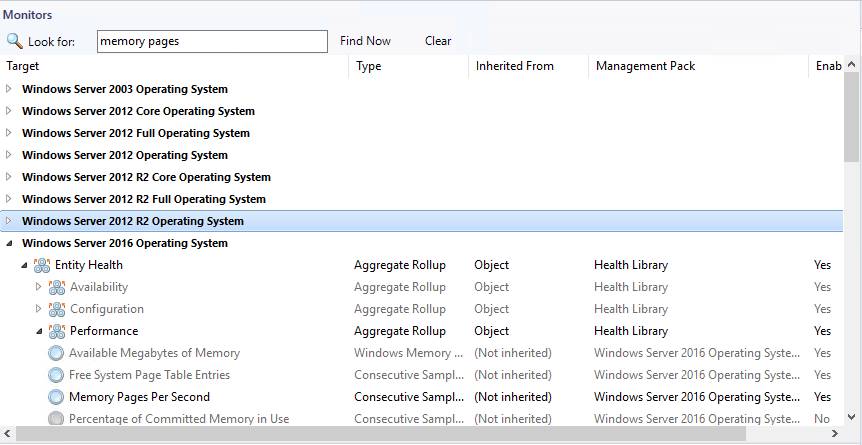
There is NO 2008 Memory Pages per second monitor

 scomconsolemonitorverify


Now to remove the override in our MP

In Notepad++, highlight the MonitorConfigurationOverride section, and delete

monitoroverridehighlight

Rinse and Repeat

Increment the version number and import MP when finished validating overrides.


Troubleshoot Office 365 SCOM MP Run As account

Run As Account

The Office 365 Run As account is used for Proxy access for an HTTPS connection from SCOM MS to Office 365 portal endpoint.

Must be a domain account, not an Azure account (particularly if they ‘re not the same tenant or AAD associated

Service Accounts are recommended to prevent impact should an employee leave


SCOM uses a domain account (example scom_action ID)

Verify that ID is in Azure tenant (contact your Azure Administrator if you don’t have access )

o365applicationazureidverify

To follow best practice, update the Run As account with the service account

o365applicationscomrunascredential


Verify Run As account

On SCOM console that there are no Operations Manager event log 7000 events for the ‘run as’ configured ID

Remote Desktop to SCOM MS Server

Verify if the ‘run as’ ID has a valid password

Look in the Operations Manager Event Log for Event ID 7000

Click on Find

Type in the user’s ID from the ‘run as’ account in SCOM

If no entries found, then ID is successfully authenticating against the domain

If errors found, correct ID/Password

Create a new subscription in SCOM to use the auto credentials option

NOTE New subscription may take 5-10 minutes to populate health data

From SCOM console

Click on Administration

Click on the Office 365 wizard

Click Add Subscription

o365applicationscomaddsubscription


Add Subscription Name

Click Next

o365applicationscomaddsubscriptionname

SCOM UI will prompt for Azure login

o365applicationscomazureauth

Enter ID and password

Click Sign in to authenticate


Click on Monitoring Tab

Click on Office 365 folder

Click on Office 365 Monitoring Dashboard

Verify state on the subscription in question

o365applicationscomnewsubscriptiondashboard