Service Map – Setting up SCOM management group


It’s time to get my SCOM MG running Service Map

Nothing like seeing what an application actually does, mapping ports a server is using, and who the server talks to!

From the docs site – https://docs.microsoft.com/en-us/azure/monitoring/monitoring-service-map-scom


Download Management Pack

Let’s start with the pack download

Download Management Pack


Install Management pack

Choose your preference

PowerShell (as admin)

Import-SCOMManagementPack -FullName “S:\monadmin\backup\$date”

In case you need help – TechNet article


Lab Example

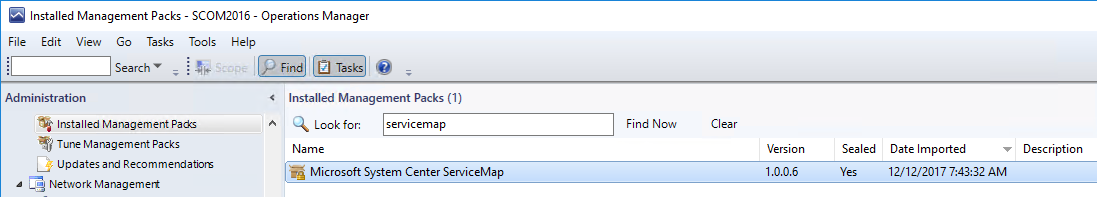
Import-SCOMManagementPack -FullName “S:\MonAdmin\SCOM\Management packs\Service Map – Blue Stripe for SCOM – OMS\v1.0.0.6\Microsoft.SystemCenter.ServiceMap.mpb”


Import via SCOM Console


Configure the Service Map integration

In SCOM Console, click on Administration Tab

Navigate to the Operations Management Suite, and expand for the Service Map selection


Click ‘Add workspace’

Paste in your Tenant ID, Application ID, and Service Principal Key that you set up prior

Click Next


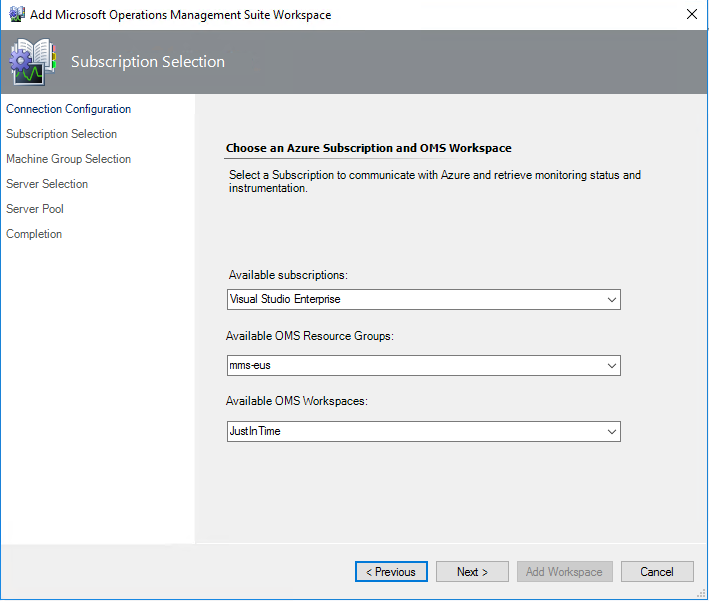
Verify Workspace Information
Click Next


Two options – if you don’t have any Windows Computer based groups in your MG, skip down to Server Selection


If there are Machine Groups to add, click ‘Add/Remove’


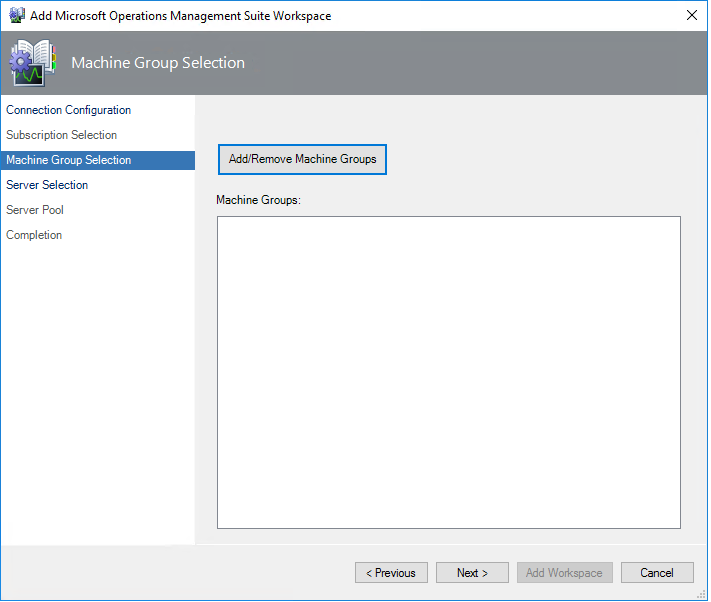
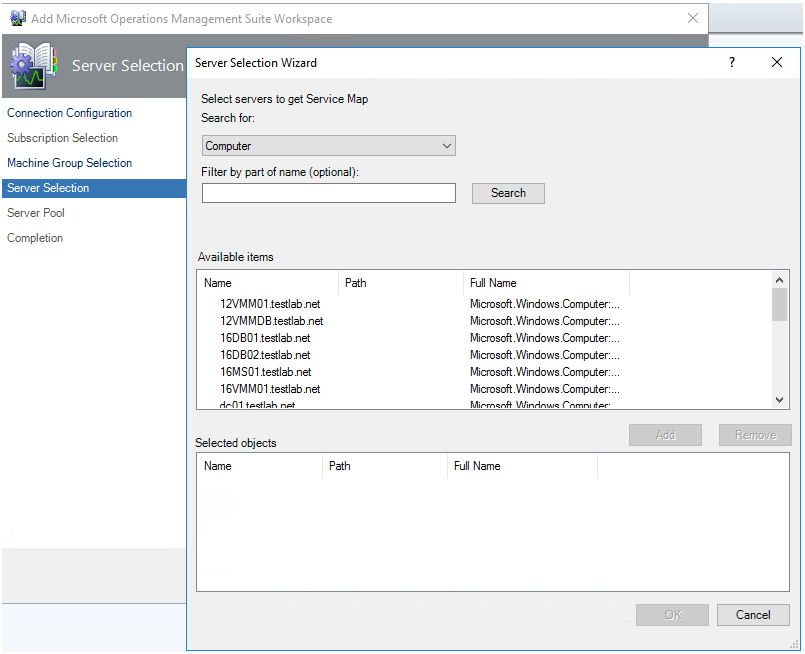
Click Next to select individual servers

Click Add

Click OK to close window


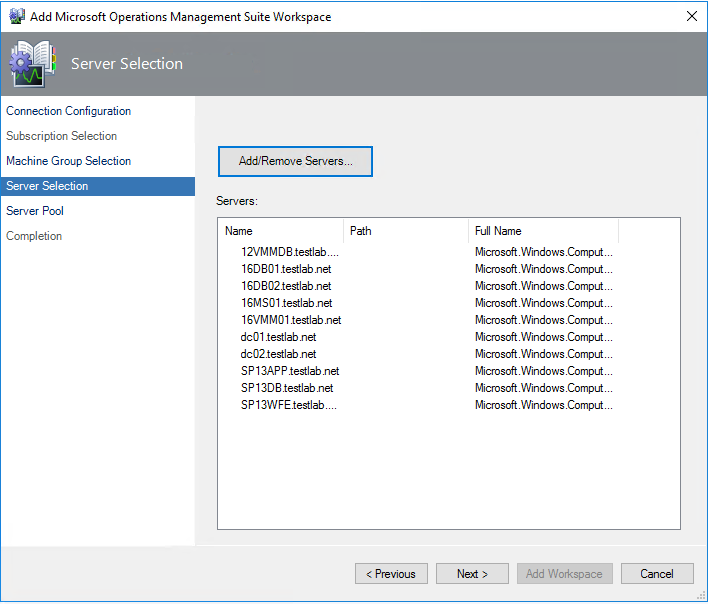
Click Next to move to next window


NOTE

  • Speed to fetch information is based on a rule see docs site
  • In the Server Selection window, you configure the Service Map Servers Group with the servers that you want to sync between Operations Manager and Service Map. Click Add/Remove Servers.

For the integration to build a distributed application diagram for a server, the server must be:

  • Managed by Operations Manager
  • Managed by Service Map
  • Listed in the Service Map Servers Group


From <https://docs.microsoft.com/en-us/azure/monitoring/monitoring-service-map-scom>


Setup proxy if needed

Click Add Workspace


Use Service Map

Time to Use the tool – https://docs.microsoft.com/en-us/azure/monitoring/monitoring-service-map


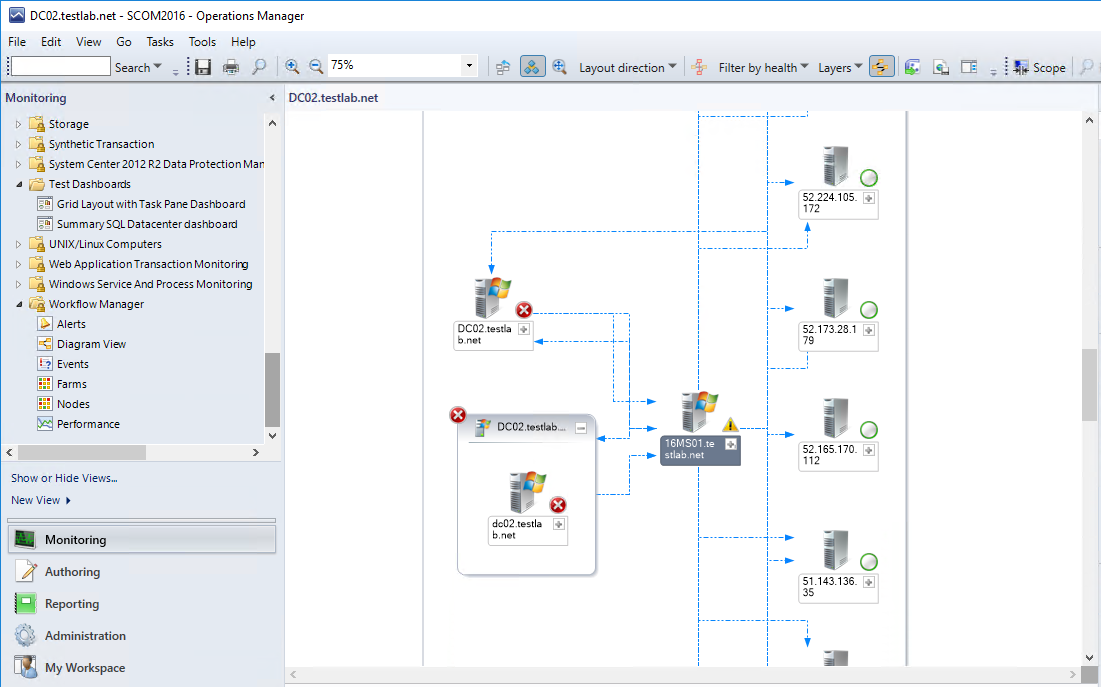
Verifying Servers specified in Service Map

Verify group

SCOM Console > Authoring Tab > Groups

Look for > Service Map

View Group members or look at Explicit tab


Troubleshooting

On Management Server (MS), Operations Manager Event log

PowerShell

get-eventlog -logname “Operations Manager” -newest 25


# This command will help if you get stuck on the workspace

get-eventlog -logname “Operations Manager” -Source “Operations Manager” -newest 25 | ? {$_.eventID -eq 6400 } |fl


GUI

Filter by Error,Warning


Install Azure Log Analytics Service Map Dependency Agent


To make all this work, sometimes, it seems like a slot machine, deposit your quarter, and hope you hit the jackpot!


So to get started, you probably have a list of computers where you have the MMA agent, and want to install Service Map to see how and who the computers are talking (to)


Login to Azure Portal

Click on Log Analytics

Click on your Subscription

Click on Service Map

Click on the Download link for Windows or Linux

Save file


Take saved file and copy to computer


GUI method

If you want a PowerShell method, Daniel Orneling has a great blog and Gallery TechNet script that will help


Docs site link has more details

Execute the InstallDependencyAgent-Windows.exe


Answer yes for UAC elevation


Click I Agree


Click Finish


Verify Agent installed


NOTE: If installing for SCOM, it's based on the Rule 'Microsoft.SystemCenter.ServiceMapImport.Rule'

https://docs.microsoft.com/en-us/azure/monitoring/monitoring-service-map-scom#configure-rules-and-overrides


PowerShell

get-eventlog -logname “Operations Manager” -Source “HealthService” -newest 25 | ? {$_.eventID -eq
1201 } |fl

get-service MicrosoftDependencyAgent


Event Viewer

Azure Log Analytics Service Map Planning and Pre-reqs

My grandfather said two things:

An ounce of prevention is worth a pound of manure

Death and taxes are part of life


Planning out a deployment is a good thing.

My best friend would say “No one plans to fail, they just fail to plan”


This will be a multi-part blog – breaking out the high level steps, and my experience getting the solution set up.


What do we need for Service Map?

  • Azure connectivity
    • Setup Log Analytics workspace on MMA/SCOM agent article
    • Troubleshooting onboarding issues KB,
      • Check for Events in Operations Manager event logs blog
  • Computers in scope for visualization
    • What computers (Windows or Linux)
    • Pricing FAQ
  • Dependency agent installed on computers
  • Azure Service Principal
    • (think of it as an SSH shared key ID/password for Azure Apps to communicate)
    • Docs article


High level steps

  1. Overview blog
  2. Install the MMA agent blog
  3. Install the dependency agent blog
  4. Configure Azure Service Principal blog
  5. Configure Service Map on SCOM blog


Possible SQL issues affecting SCOM performance


Good reasons for a Risk Assessment


SQL RAS runs 800+ queries to check on target SQL servers

Check Best Practice Recommendations (BPR)


May be good opportunity to audit the SQL build for BPR!


Ran across some good examples where SQL settings brought SCOM to a standstill

One was Cardinality Estimation – basically, predicts how many rows a query will return

Part of SQL since 1998 with SQL Server v7.0


Let’s figure out what SQL2016 runs OoB (out of box)


SQL 2016

SELECT ServerProperty(‘ProductVersion’);
GO 


SELECT name, value
FROM sys.database_scoped_configurations
WHERE name = ‘LEGACY_CARDINALITY_ESTIMATION’;
GO


The other is CLR Strict Security

SELECT * FROM sys.configurations

WHERE name = ‘clr enabled’


Talking with Shawn Nakhostin – SQL PFE, we discussed opportunities and questions around SQL optimization and best practices.

Shawn gave me the following feedback on customer performance issues:

I’ve found some customers who have had performance issues with SQL based on organizational SQL settings:

  1. Trace flag 9481
  2. CLR Strict Security is by default enabled


Trace flag 9481

Enabling or disabling this TF is not a matter of best practice.

The customer should see what works for them.

Here is the explanation:

Customer started using a new cardinality estimator in SQL Server 2014.

The product team knew that the new CE improved some of the query plans, but not all of them. In other words, they knew that this would improve overall query performance in “some” environments but might have a different impact in other environments.

For this reason, they created TF 9481 so that environments that see query performance degradation after upgrading SQL Server from version 2012 and earlier, they can turn on this trace flag so that the query optimizer uses the old algorithm for CE.

Note:-Trace flag 9481 forces the query optimizer to use version 70 (the SQL Server 2012 version) of the cardinality estimator when creating the query plan.

https://blogs.technet.microsoft.com/dataplatform/2017/03/22/sql-server-2016-new-features-to-deal-with-the-new-ce/

https://support.microsoft.com/en-in/help/2801413/enable-plan-affecting-sql-server-query-optimizer-behavior-that-can-be


CLR Strict Security is by default enabled

This causes all assemblies to be treated as unsafe.

As a result, assemblies will not load.

To get the assemblies to load they can do one of the following:

  • Sign the assembly. This may work if you have a few assemblies but becomes a huge task if there are many assemblies to sign.
  • Set the TRUSTWORTHY database property to on.
    • This is not recommended because in some form defeats the purpose of using CLR Strict Security.
  • Add the assembly to the trusted assemblies list.
    • This is called whitelisting, which may be a better option than the previous two.

https://docs.microsoft.com/en-us/sql/database-engine/configure-windows/clr-strict-security?view=sql-server-2017


Updated Skype for Business 2015 (premise) Addendum MP

Updated and completed for Company Knowledge!


Many thanks to Nick Wood for his help deciphering user impact for these alerts.

Reach out to Nick on LinkedIn


This has been an arduous effort to complete the Skype alerts and components.


Gallery Download


It’s taken a few steps along the way, to get all the content delivered.


To read the whole Skype Addendum journey, please read these additional blog posts
June blog
January blog


The initial Addendum pack with just service recoveries and Azure overrides

Old pack https://gallery.technet.microsoft.com/Skype-for-Business-2015-b005f49f
This download disabled Azure, set service recovery tasks


The new Gallery download contains the following:

Skype SCOM Alerts.xls
Microsoft.LS.2015.Monitoring.ComponentAndUser.Addendum.xml
Microsoft.SystemCenter.Notifications.Internal.xml
Skype.for.Business.Server.Management.Pack.Alert.Grooming.xml


NOTE The Skype.for.Business.Server.Management.Pack.Install.txt file contains the information as well


#############################################################
#
# Breakdown of files
#
#############################################################

#
# Skype SCOM Alerts.xls
# Skype SCOM Alerts XLS is is MP Export excerpt formatted for XLS workbook
#
# Feel free to search this file

# Column D is ‘Escalate to Who’
# This has values as SCOM Engineering, Messaging Ops, Telephony, Messaging Engineering
# Column E is impact
# This has values: P3-P5, *Email
# Column F is the Display String for the monitor
# Column H has the User Impact, Cause, and Troubleshooting steps


#
# Microsoft.LS.2015.Monitoring.ComponentAndUser.Addendum.xml
# Addendum management pack sets up company knowledge tab for each Skype monitor, with actionable troubleshooting steps.
#


#
# Microsoft.SystemCenter.Notifications.Internal.xml
#

# Backup the current MP first, and merge if you are adding this to your environment!
# Use this pack cautiously, as it will replace existing Channels, subscribers, subscriptions.

# On Management server, open PowerShell window as Admin
#
# cd <path>
# Example

cd $HOME/desktop
Get-SCOMManagementPack -Name *Notification* | export-SCOMmanagementpack  -path “C:\”

Copy-item .\Microsoft.SystemCenter.Notifications.Internal.xml .\Original-<CompanyName>-Microsoft.SystemCenter.Notifications.Internal.xml


# Save the bundled Notifications pack to the same path

# YES it’s that important, the file can eliminate any alerts leaving SCOM!
#
# Save file to local drive

# Follow MP Fragment authoring if you need to merge existing Notifications with Skype pack
# https://kevinholman.com/2016/06/04/authoring-management-packs-the-fast-and-easy-way-using-visual-studio/
#

#
# Skype.for.Business.Server.Management.Pack.Alert.Grooming.xml
#
# This file is to set alerts per the XLS, making warnings for P4,P5, email, and P3 for Critical

#
#############################################################


What ID’s is SCOM using

Ever need to audit what ID’s SCOM is using?

Maybe you have to figure out how someone else setup SCOM.

Did they set up SCOM as recommended for best practices with different AD accounts per role?


If the ID’s are not logged during install, it’s a little more difficult to figure out what ID was used.

  • Domain Account for ALL services,
  • Enter in the unique DOMAIN\OMAA, DOMAIN\OMDAS, DOMAIN\OMREAD, DOMAIN\OMWRITE


Try these PowerShell commands to find what SCOM is using.


ON MS (from PowerShell (don’t need admin unless you’re restarting services)

$Services = ( Get-WmiObject -Class Win32_Service )

$Services | ? { $_.Name -eq “OMSDK” -OR $_.Name -eq “cshost” -OR $_.Name -eq “HealthService” } |

ft name,Startname,StartMode


ON SCOM DB’s, Reporting (from PowerShell (don’t need admin unless you’re restarting services)

$Services = ( Get-WmiObject -Class Win32_Service )

$Services | ? { $_.DisplayName -like “*SQL*” } | ft name,Startname,StartMode


Source https://blogs.technet.microsoft.com/heyscriptingguy/2012/02/15/the-scripting-wife-uses-powershell-to-find-service-accounts/


Skype for Business 2015 (premise) Addendum MP

Ever try to figure out a Skype alert, for which server in the pool(s) is failing?


While maybe not the clearest to find root cause, the Skype pack brings a bunch of functionality, including synthetic transactions.


I was lucky enough to collaborate with Nick Wood, Skype PFE, to help provide more detail, troubleshooting, impact on what is critical versus warning.


What the addendum pack brings

Do you think 656 monitors can all be critical?

  • Sets up service restart recovery tasks for all Skype services
  • Company Knowledge tab for troubleshooting/user impact


Gallery Download


Here is a visual of our Skype efforts for integrating troubleshooting details into SCOM console.

NOTE:  Company Knowledge tab would be accessible from the alert as well


Company Knowledge

SCOM Console, Authoring tab, Dispatcher Queue monitor

Highlight monitor, right click, choose properties

Click on ‘Company Knowledge’ tab

Incorporated the XLS into SCOM under Company Knowledge for additional information on user impact, causes, and troubleshooting (under resolutions)


Active Directory 2012-2016 Addendum packs updated

Man time flies!


Thought I’d share some new functionality for AD DS (Active Directory Domain Services)


Ran across some customer errors with AD Event ID 1084, which exists in the old 8321 pack, but not in the v10.x pack.

Well, if you get these errors, your DC isn’t replicating, and most likely will need to be rebuilt.


Gallery download


Broke out the packs to separate the Recovery Tasks in their own pack, versus added functionality in the addendum.

Figured better to send packs NOT sealed, so that meant 2 packs,

WYSIWYG (wizzy-wig acronym)


What this means

v1.0.0.1 pack had just the AD DS Service Recovery Tasks

v1.0.0.2 pack has a Service Recovery Tasks pack, and the Addendum pack

What I think is cool is that the Addendum pack contains 2 rules, simple rule event (enabled by default), and also a PowerShell rule.


Rule Figured out how to simply look for criteria, count it, and alert on it.

We always look for alert suppression, some of the sliding/counting monitors are too much.


Starting with Holman’s alerting rule fragment, we can create more powerful combinations than just a single symptom.

Using Variations of the get-date command, we can actually specify how far back to look, to count for alerts.

Easier method to count events, to figure out an alert threshold.


From the rule in the Addendum pack

# Check blog for more detail https://blogs.technet.microsoft.com/heyscriptingguy/2015/01/21/adding-and-subtracting-dates-with-powershell/
# If you want this in other time increments – AddHours, AddSeconds, AddMilliseconds
#
$LastCheck = (Get-Date).AddMinutes(-65)

[int]$TempCount = (get-eventlog -logName “Directory Service” -Source “NTDS Replication” -InstanceID 1084 -Message “*8451 The replication operation encountered a database error*” -After $LastCheck).Count

IF ($TempCount -ge 1)
{
$Result = “BAD”
$Message = “The number of 1084 Replication Database error events was greater than 1”
}
ELSE
{
$Result = “GOOD”
}


Maybe we need multiple event ID’s, or search multiple event logs… you decide, and let me know.


SQL MP bloat

Updated 25 Feb 2023


Ever wish alerts were like a wad of cash?

The more you solve, the more you make!


How about performance counter data?


The SQL management packs are awesome for visualizations, and provide a bunch of data.


Tim McFadden pointed out SQL Performance counters https://www.scom2k7.com/crazy-db-performance-collection-rules-in-the-sql-mps/

His blog brings up SQL MP Disk Latency performance counters.


His blog got me thinking about SQL DB and DB file design, where multiple DB files are on the same Drive, causes duplicate performance counters (SCOM workflows) on the agent, and will typically be one of the culprits for HealthService restarts.


SQL MP creates performance counters (per DB file, group, instance, engine)


Let’s start with how I figured out why all my money goes into storage.


Start in the SCOM console

Click on the Reporting Tab

Click on the ‘System Center Core Monitoring Reports’ folder

Double click on the Data Volume by Management Pack

View of SCOM report from console reporting tab

Select the timeframe (from, to)

Click Run

Data Volume MP selected


Reporting Data

I have 2 2016 DB’s and 1 2014 (SCVMM) database server monitored, and it’s 50% of my data volume!


Another example – had the DW shutdown for days

Data volume of SQL after


Did you know there are 60+ perf counter rules in 2012 alone, and nearly 200 in 2016?


How about an OFF pack, a management pack that turns off all the performance counter rules?

The monitors still exist for health, just no pretty performance graph, should you look.


Github repo link

Check out the Gallery post for download

TechNet gallery download


Zip file contains

  1.  OFF MP’s for 2008,2012,2014,2016
  2. XLS sheets to allow you to go to the SQL team and ask them what performance counters they use


2016 SQL SP1 patch issue

False alert?


If you have SQL2016 SP1 monitored in SCOM, you most likely have Compliance monitor warnings


This is actually a problem with SP1 where SQL did not update the registry key.


Two options to remedy:

  1. Disable SCOM monitor per instance (or class if SP1 is NOT in your environment)
  2. Fix the offending SQL Servers that are patched to SP1


Steps to fix the offending SQL Servers patched to SP1

Update Registry Key


Via PowerShell


TechNet forum is nice as well, but had to tweak it (blog listed here )


# Get Instance

$Instance = (Get-ItemProperty “HKLM:\SOFTWARE\Microsoft\Microsoft SQL Server”).InstalledInstance )

NOTE: If you have multiple instances, you will need a foreach loop

# Get Version

$Version = (Get-ItemProperty “HKLM:\SOFTWARE\Microsoft\Microsoft SQL Server\$((Get-ItemProperty ‘HKLM:\SOFTWARE\Microsoft\Microsoft SQL Server\Instance Names\SQL’).$Instance)\Setup”).Version

# Match Version and set Registry Key
if ($Version -match ‘13.1.4’)

{

Set-ItemProperty -Path “HKLM:\SOFTWARE\Microsoft\Microsoft SQL Server\$((Get-ItemProperty ‘HKLM:\SOFTWARE\Microsoft\Microsoft SQL Server\Instance Names\SQL’).$Instance)\Setup” -Name ‘SP’ -Value 1

}

# Verify

Get-ItemProperty -path “HKLM:\Software\Microsoft\Microsoft SQL Server\MSSQL13.MSSQLSERVER\Setup” | ft SP


Steps broken out


Get Registry Key value via PowerShell


Get-ItemProperty -path “HKLM:\Software\Microsoft\Microsoft SQL Server\MSSQL13.MSSQLSERVER\Setup” | ft SP


Set Registry Key


Set-ItemProperty -path “HKLM:\Software\Microsoft\Microsoft SQL Server\MSSQL13.MSSQLSERVER\Setup” -name “SP” -value 1


Verification

Verify via PowerShell


Verify via RegEdit


Reset SCOM Monitor


And the false alert is gone!